 12
12peptides
spectra
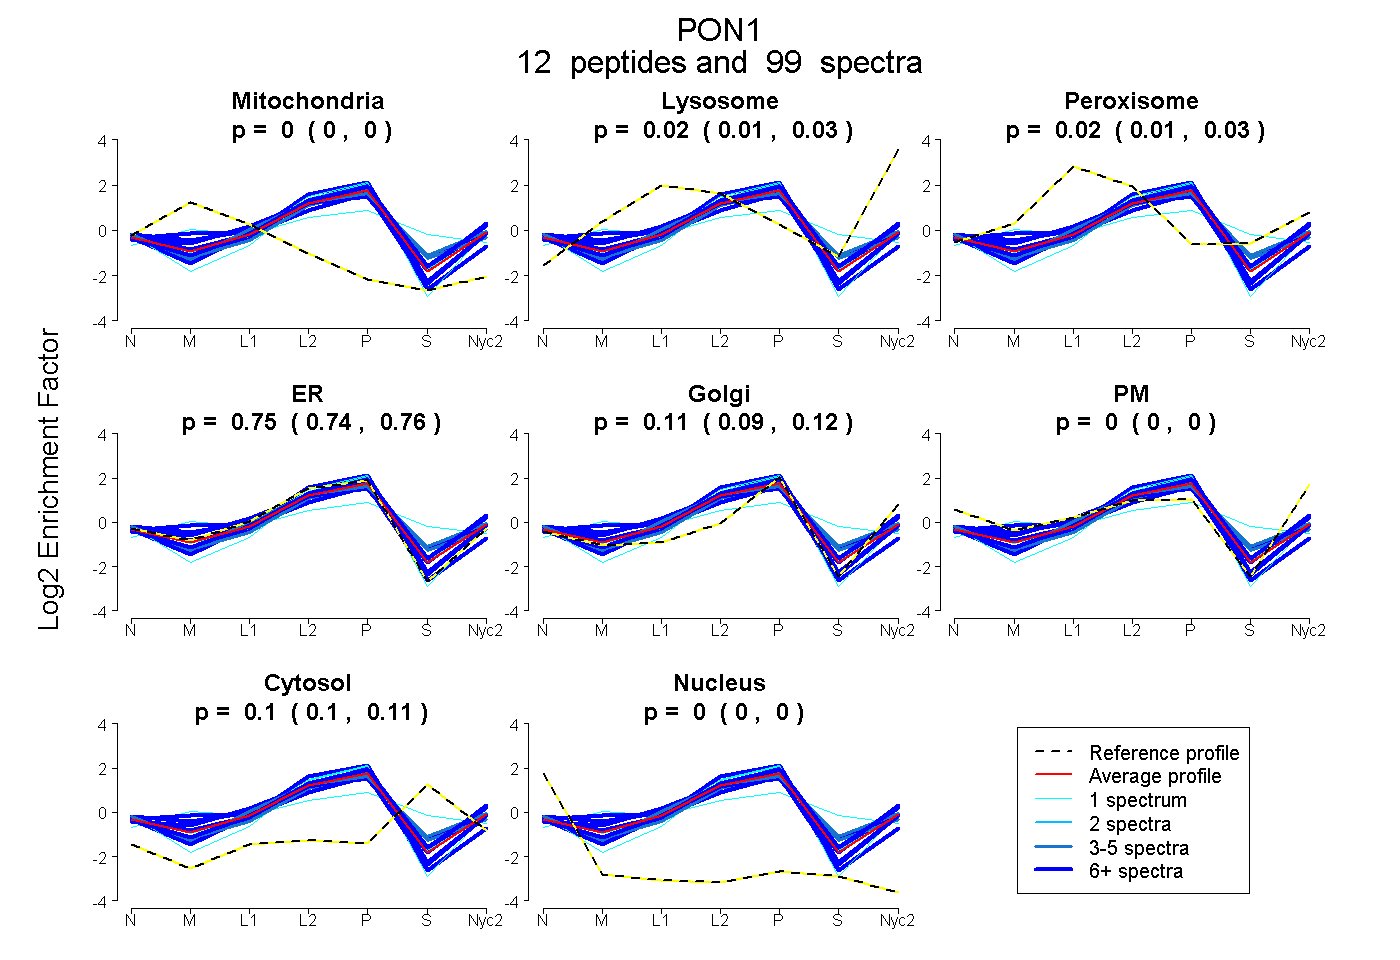
0.000 | 0.000
0.013 | 0.026
0.010 | 0.027
0.738 | 0.761
0.094 | 0.119
0.000 | 0.000
0.098 | 0.107
0.000 | 0.000
| Plot | Mito | Lyso | Perox | ER | Golgi | PM | Cytosol | Nucleus | |||||
| Expt A |
12 peptides |
99 spectra |
|
0.000 0.000 | 0.000 |
0.020 0.013 | 0.026 |
0.019 0.010 | 0.027 |
0.750 0.738 | 0.761 |
0.108 0.094 | 0.119 |
0.000 0.000 | 0.000 |
0.103 0.098 | 0.107 |
0.000 0.000 | 0.000 |
| 8 spectra, ALCCDL | 0.061 | 0.000 | 0.000 | 0.939 | 0.000 | 0.000 | 0.000 | 0.000 | ||
| 13 spectra, IFFYDSENPPGSEVLR | 0.000 | 0.000 | 0.000 | 0.892 | 0.065 | 0.000 | 0.042 | 0.000 | ||
| 3 spectra, VVADGFDFANGIGISLDGK | 0.000 | 0.018 | 0.066 | 0.704 | 0.000 | 0.022 | 0.190 | 0.000 | ||
| 1 spectrum, SLLHLK | 0.000 | 0.000 | 0.000 | 0.873 | 0.127 | 0.000 | 0.000 | 0.000 | ||
| 1 spectrum, LLIGTVFHR | 0.000 | 0.000 | 0.000 | 0.720 | 0.158 | 0.000 | 0.123 | 0.000 | ||
| 6 spectra, ILLMDLNEK | 0.000 | 0.055 | 0.000 | 0.599 | 0.223 | 0.010 | 0.113 | 0.000 | ||
| 4 spectra, SFDPSKPGK | 0.000 | 0.000 | 0.000 | 0.736 | 0.060 | 0.000 | 0.204 | 0.000 | ||
| 17 spectra, IHVYEK | 0.000 | 0.000 | 0.089 | 0.550 | 0.199 | 0.000 | 0.162 | 0.000 | ||
| 1 spectrum, HANWTLTPLK | 0.041 | 0.000 | 0.222 | 0.362 | 0.081 | 0.000 | 0.294 | 0.000 | ||
| 20 spectra, YVYIAELLAHK | 0.000 | 0.066 | 0.000 | 0.692 | 0.143 | 0.000 | 0.098 | 0.000 | ||
| 14 spectra, SSYQTR | 0.097 | 0.048 | 0.000 | 0.724 | 0.131 | 0.000 | 0.000 | 0.000 | ||
| 11 spectra, IQSILSEDPK | 0.000 | 0.000 | 0.135 | 0.522 | 0.193 | 0.097 | 0.052 | 0.000 |
| Plot | Mito | Lyso or Perox | ER | Golgi | PM | Cytosol | Nucleus | ||||||
| Expt B |
10 peptides |
63 spectra |
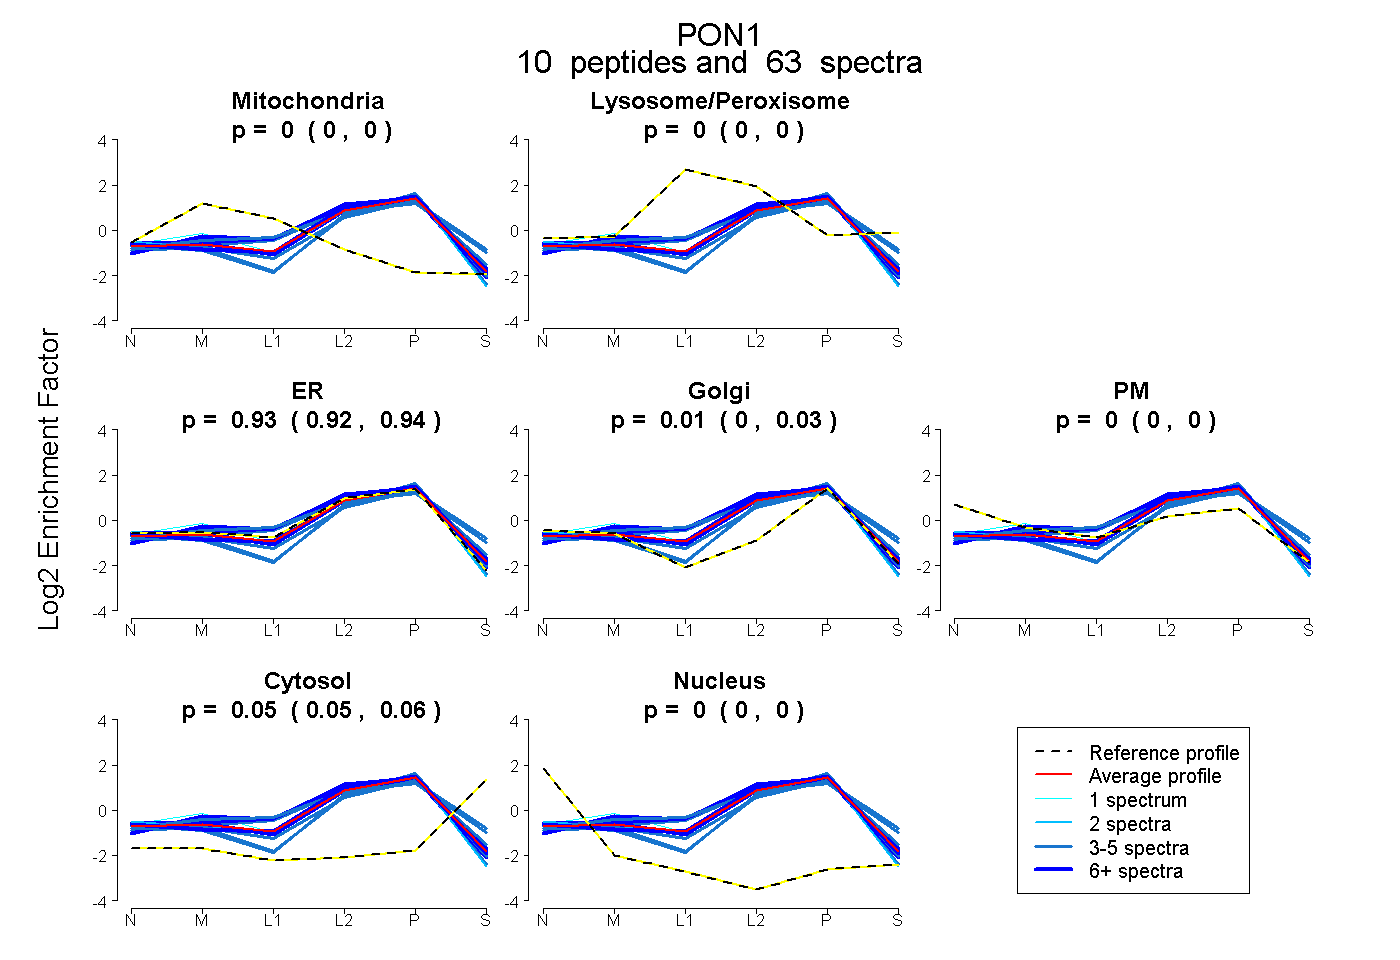 |
0.000 0.000 | 0.000 |
0.000 0.000 | 0.000 |
0.933 0.920 | 0.944 |
0.014 0.000 | 0.027 |
0.000 0.000 | 0.000 |
0.053 0.048 | 0.056 |
0.000 0.000 | 0.000 |
|||
| Plot | Lyso | Other | |||||||||||
| Expt C |
9 peptides |
216 spectra |
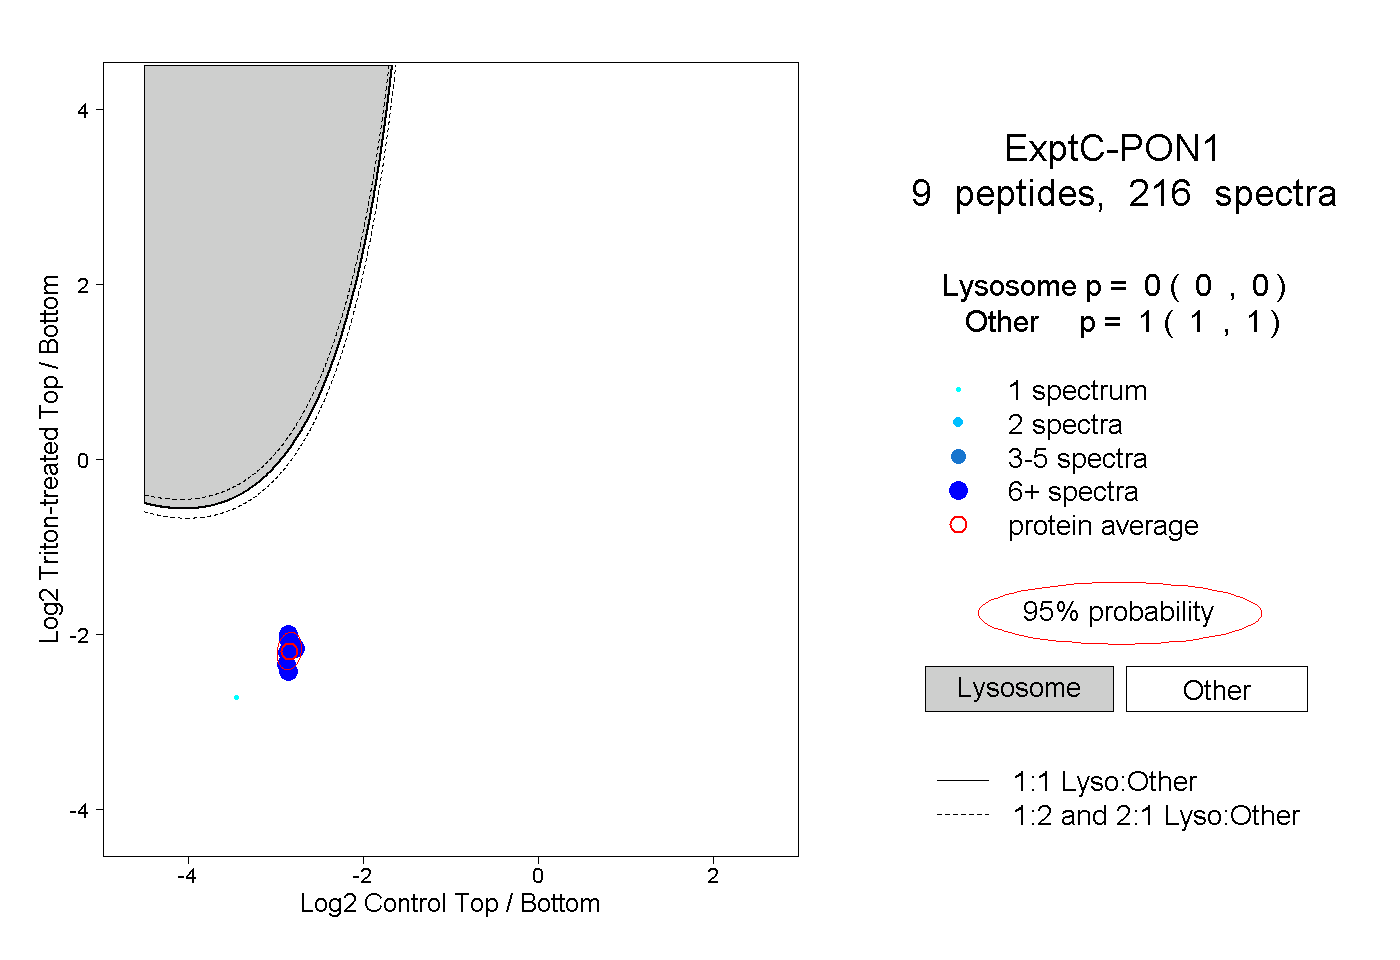 |
0.000 0.000 | 0.000 |
1.000 1.000 | 1.000 |
||||||||
| Plot | Lyso | Other | |||||||||||
| Expt D |
8 peptides |
19 spectra |
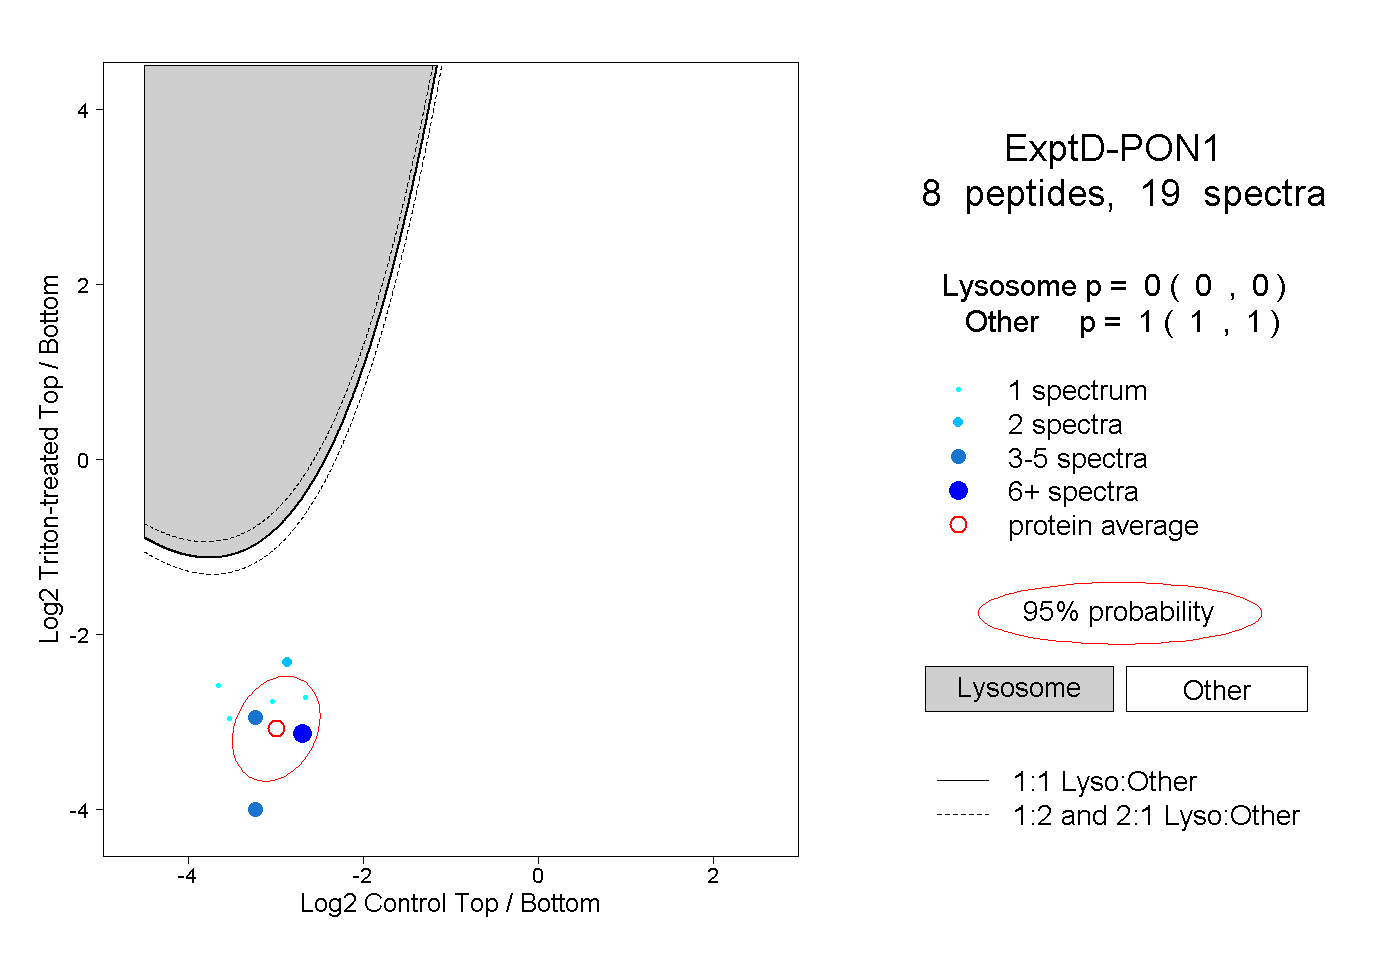 |
0.000 0.000 | 0.000 |
1.000 1.000 | 1.000 |