 7
7peptides
spectra
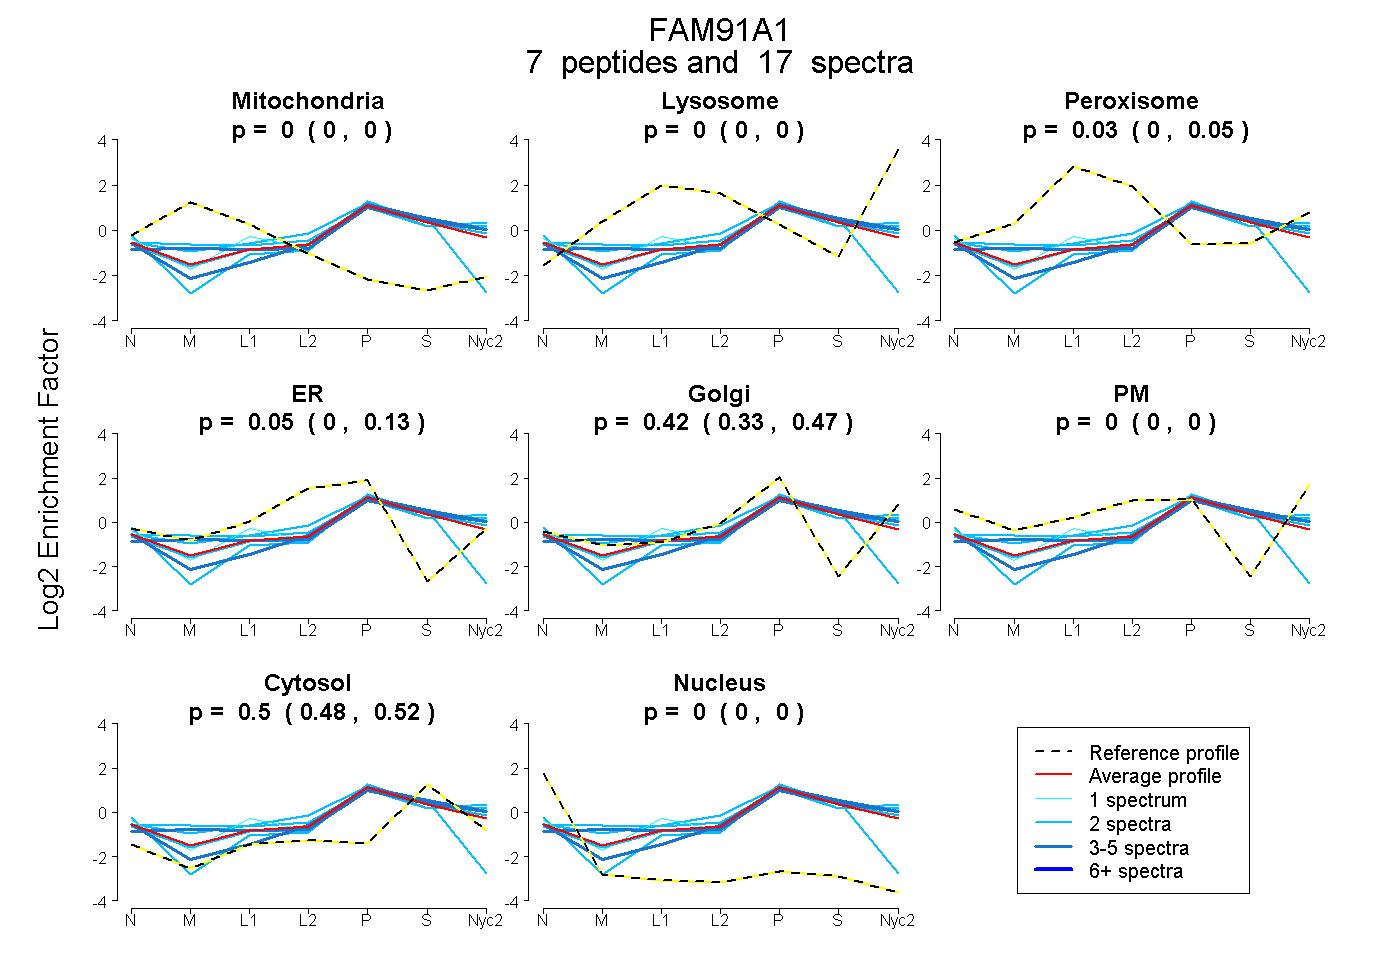
0.000 | 0.000
0.000 | 0.000
0.000 | 0.053
0.000 | 0.128
0.334 | 0.469
0.000 | 0.000
0.479 | 0.520
0.000 | 0.000
2peptides
spectra
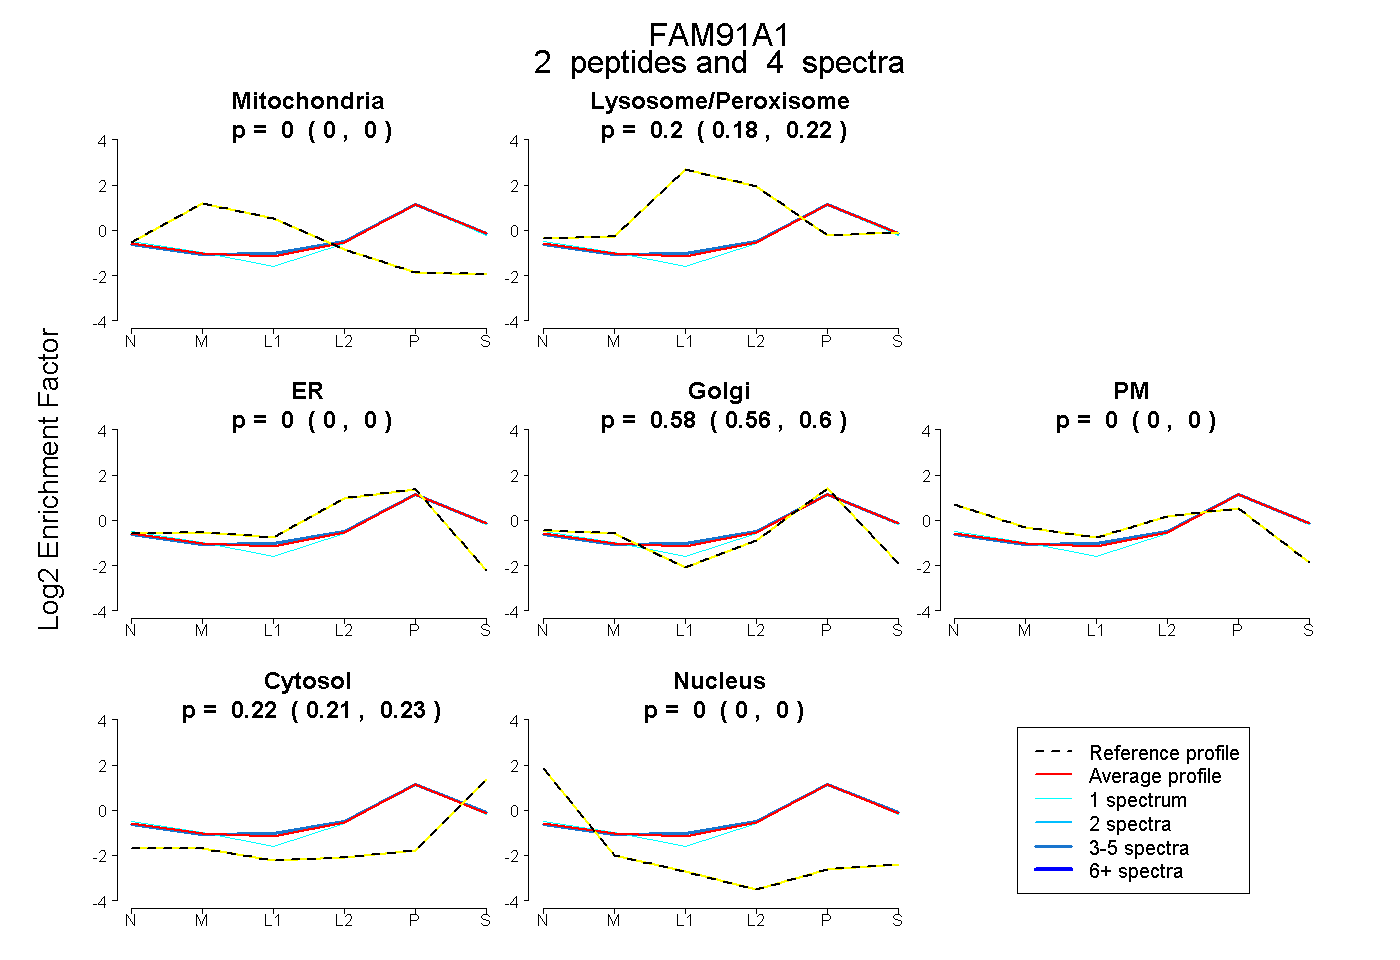
0.000 | 0.000
0.178 | 0.223
0.000 | 0.000
0.564 | 0.595
0.000 | 0.000
0.205 | 0.225
0.000 | 0.000
7peptides
spectra
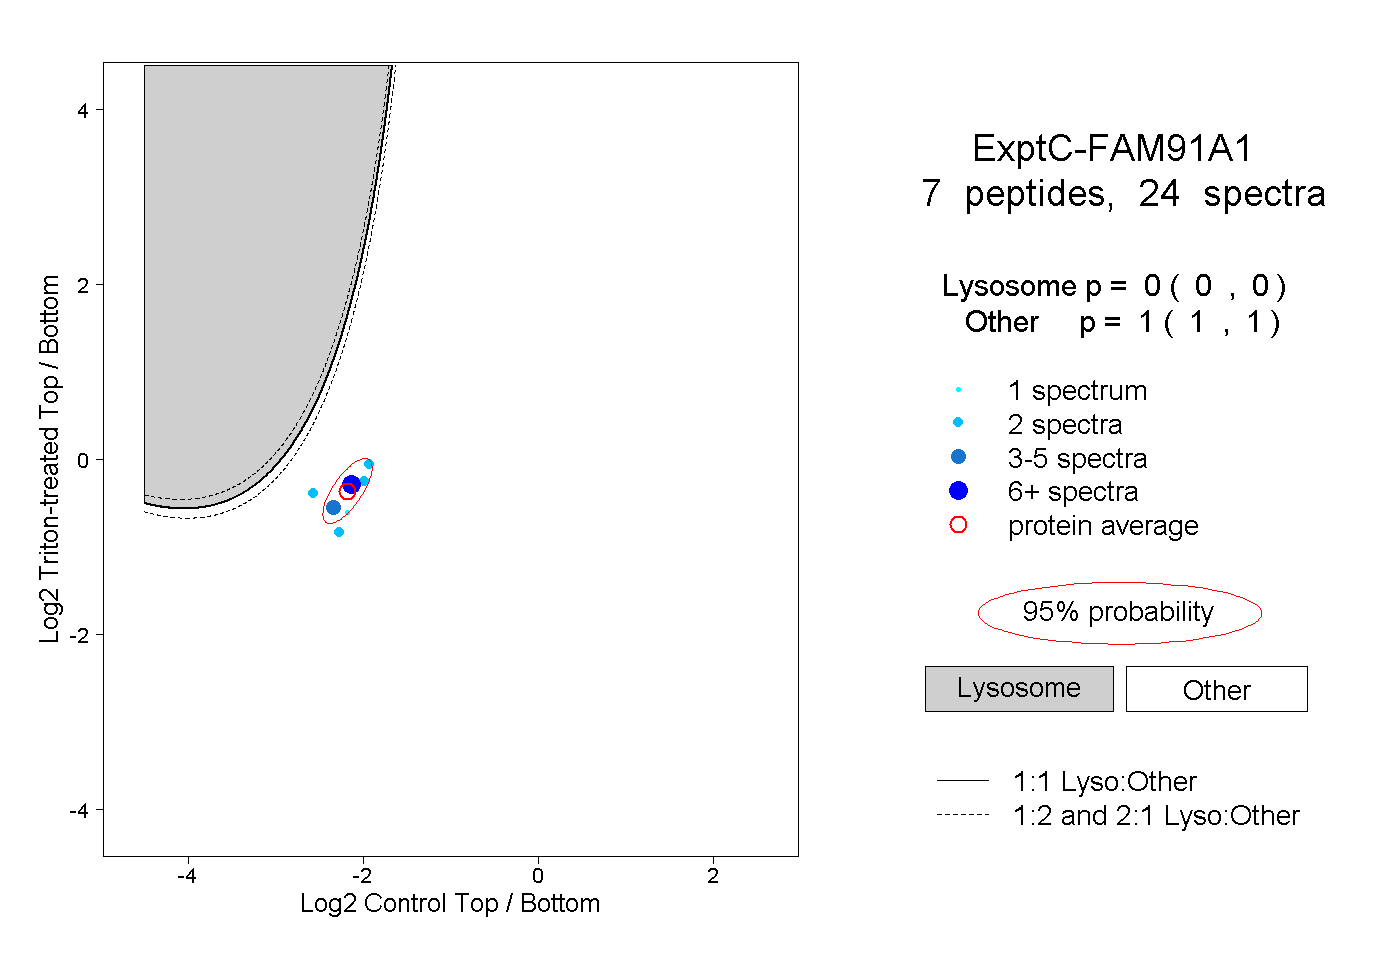
0.000 | 0.000
1.000 | 1.000