 1
1peptide
spectra
0.000 | 0.000
0.000 | 0.000
0.014 | 0.092
0.165 | 0.272
0.000 | 0.104
0.190 | 0.319
0.390 | 0.446
0.000 | 0.000
1peptide
spectrum
NA | NA
NA | NA
NA | NA
NA | NA
NA | NA
NA | NA
NA | NA
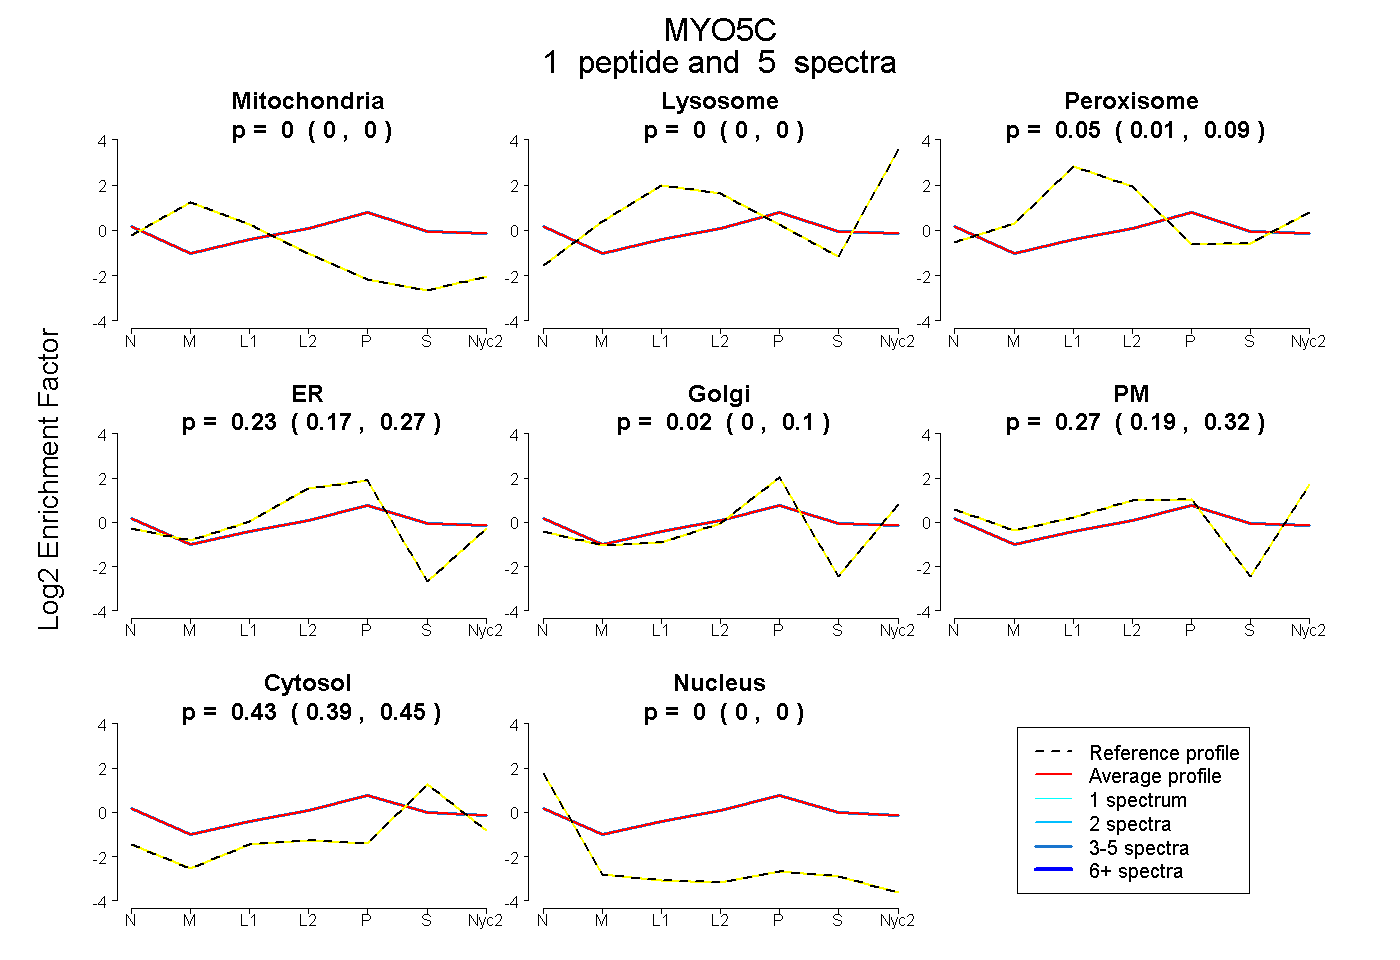
| Plot | Mito | Lyso | Perox | ER | Golgi | PM | Cytosol | Nucleus | |||||
| Expt A |
1 peptide |
5 spectra |
|
0.000 0.000 | 0.000 |
0.000 0.000 | 0.000 |
0.049 0.014 | 0.092 |
0.233 0.165 | 0.272 |
0.019 0.000 | 0.104 |
0.272 0.190 | 0.319 |
0.427 0.390 | 0.446 |
0.000 0.000 | 0.000 |
||
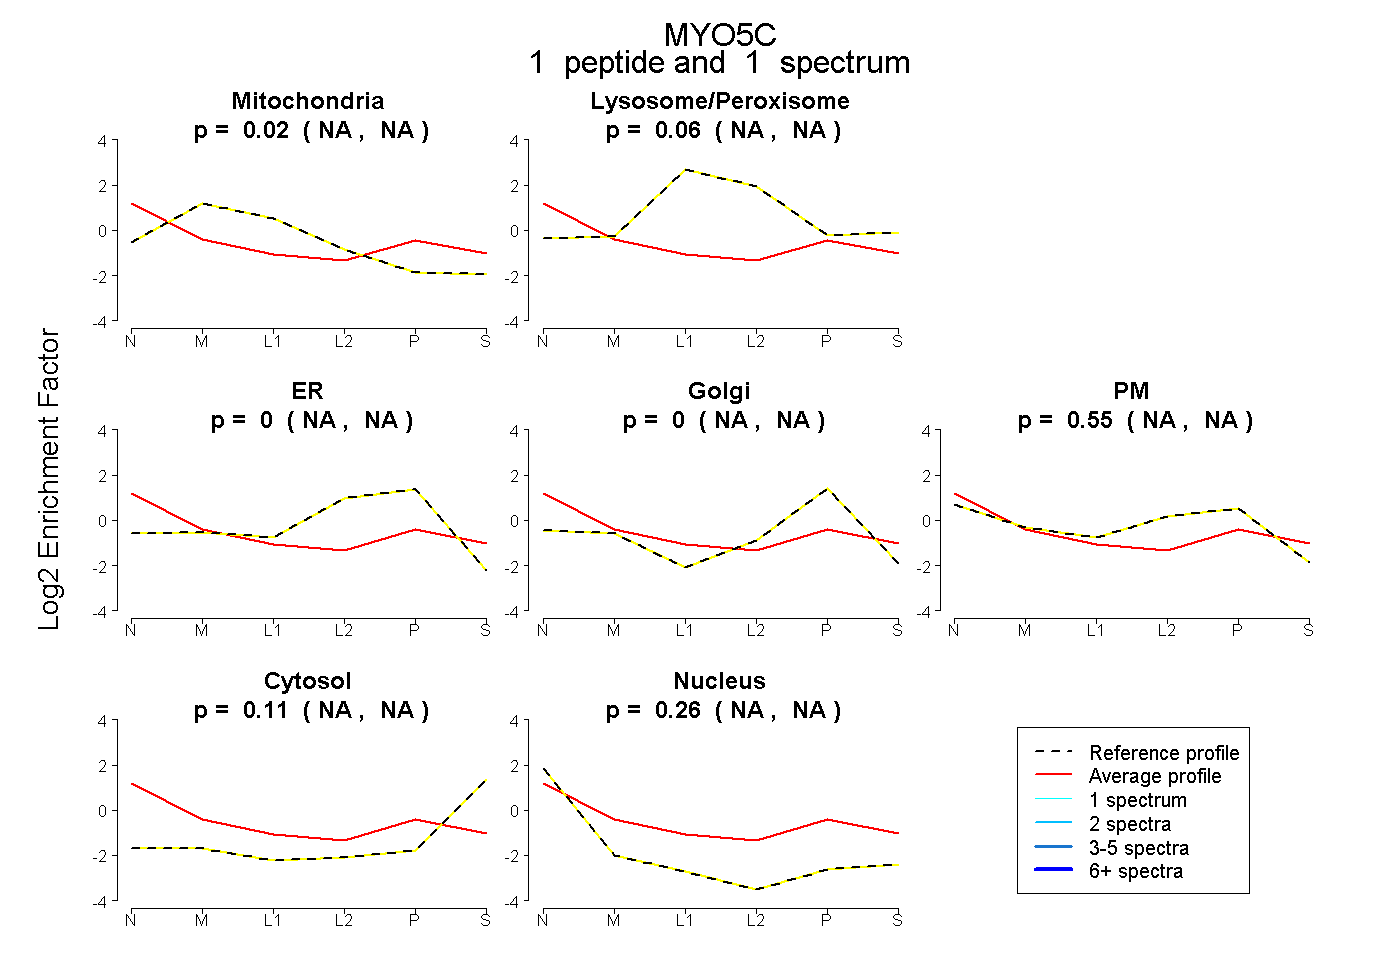
| Plot | Mito | Lyso or Perox | ER | Golgi | PM | Cytosol | Nucleus | ||||||
| Expt B |
1 peptide |
1 spectrum |
|
0.023 NA | NA |
0.060 NA | NA |
0.000 NA | NA |
0.000 NA | NA |
0.548 NA | NA |
0.107 NA | NA |
0.262 NA | NA |
| 1 spectrum, LVQQLR | 0.023 | 0.060 | 0.000 | 0.000 | 0.548 | 0.107 | 0.262 |
| Plot | Lyso | Other | |||||||||||
| Expt C |
1 peptide |
1 spectrum |
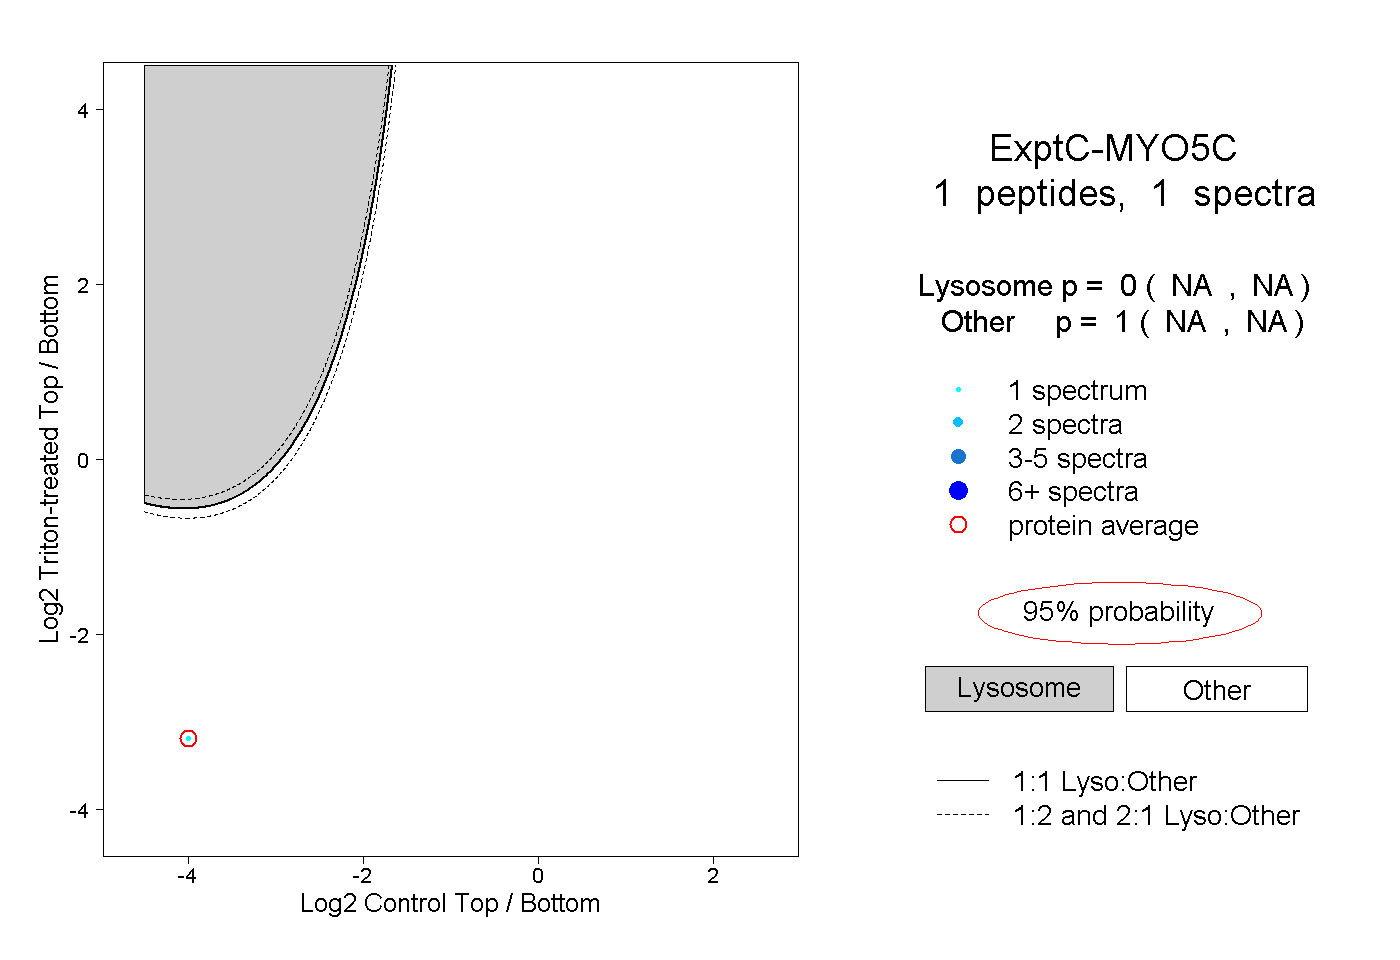 |
0.000 NA | NA |
1.000 NA | NA |
||||||||
| Plot | Lyso | Other | |||||||||||
| Expt D |
1 peptide |
1 spectrum |
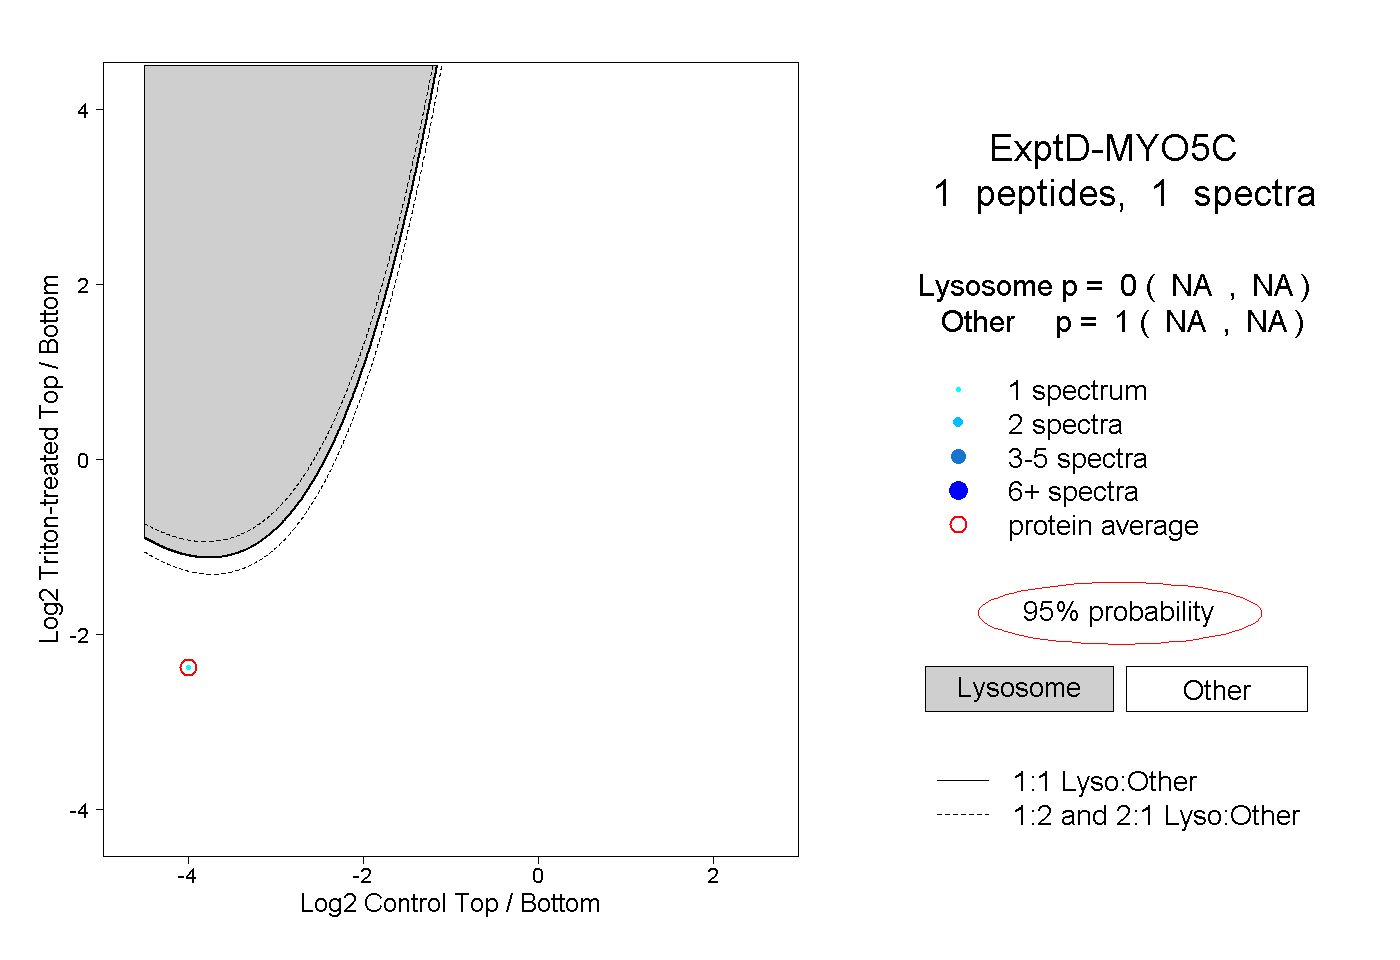 |
0.000 NA | NA |
1.000 NA | NA |