 1
1peptide
spectra
0.000 | 0.000
0.652 | 0.722
0.000 | 0.000
0.000 | 0.000
0.000 | 0.037
0.200 | 0.270
0.040 | 0.083
0.000 | 0.000
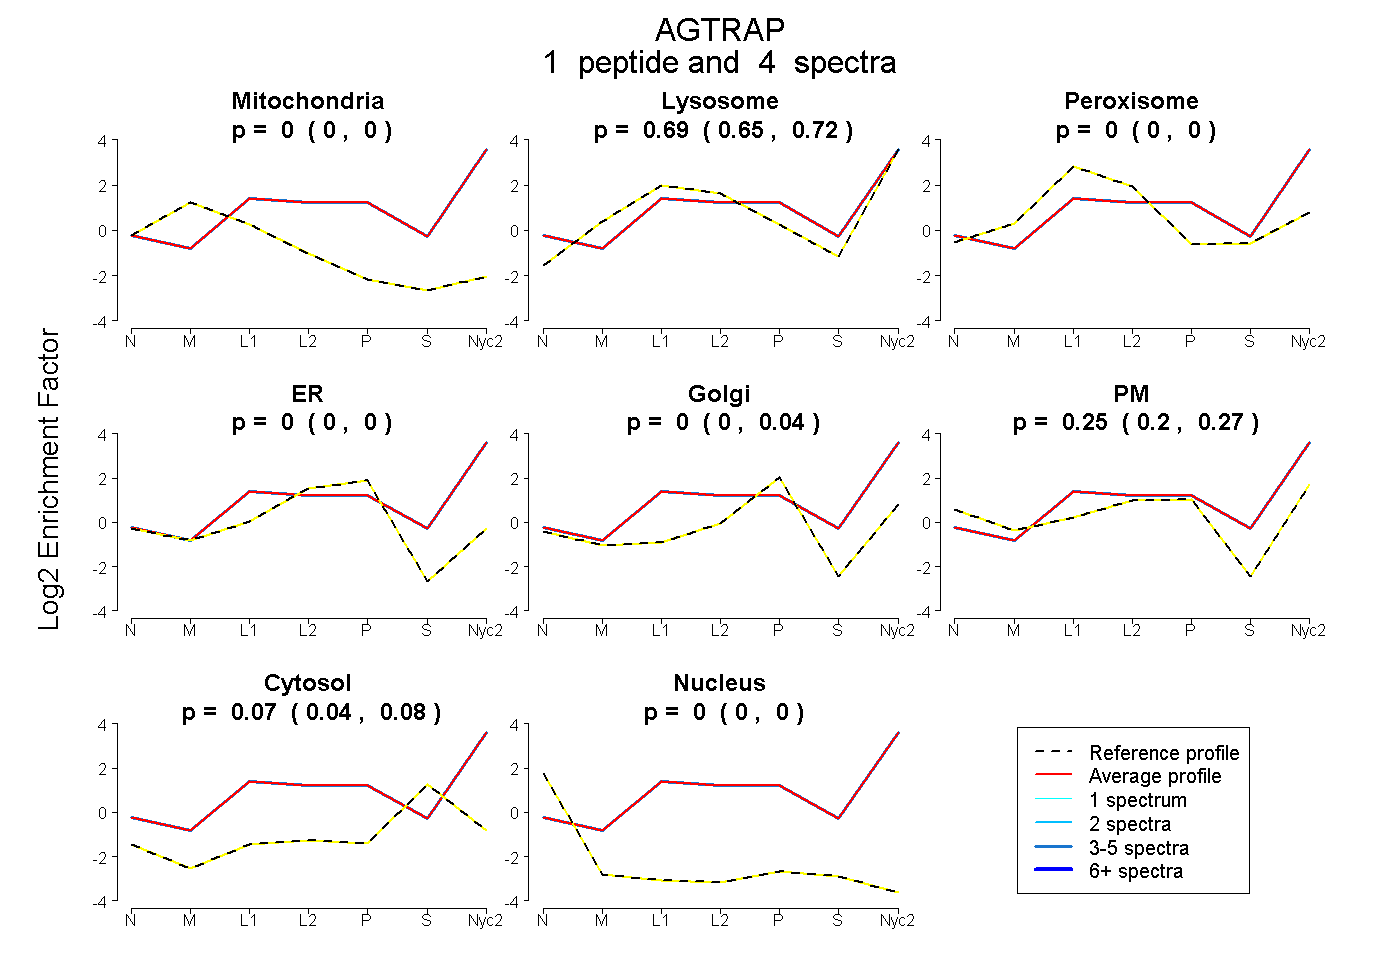
| Plot | Mito | Lyso | Perox | ER | Golgi | PM | Cytosol | Nucleus | |||||
| Expt A |
1 peptide |
4 spectra |
|
0.000 0.000 | 0.000 |
0.687 0.652 | 0.722 |
0.000 0.000 | 0.000 |
0.000 0.000 | 0.000 |
0.000 0.000 | 0.037 |
0.247 0.200 | 0.270 |
0.066 0.040 | 0.083 |
0.000 0.000 | 0.000 |
| 4 spectra, GGELPLR | 0.000 | 0.687 | 0.000 | 0.000 | 0.000 | 0.247 | 0.066 | 0.000 |
| Plot | Lyso | Other | |||||||||||
| Expt C |
2 peptides |
6 spectra |
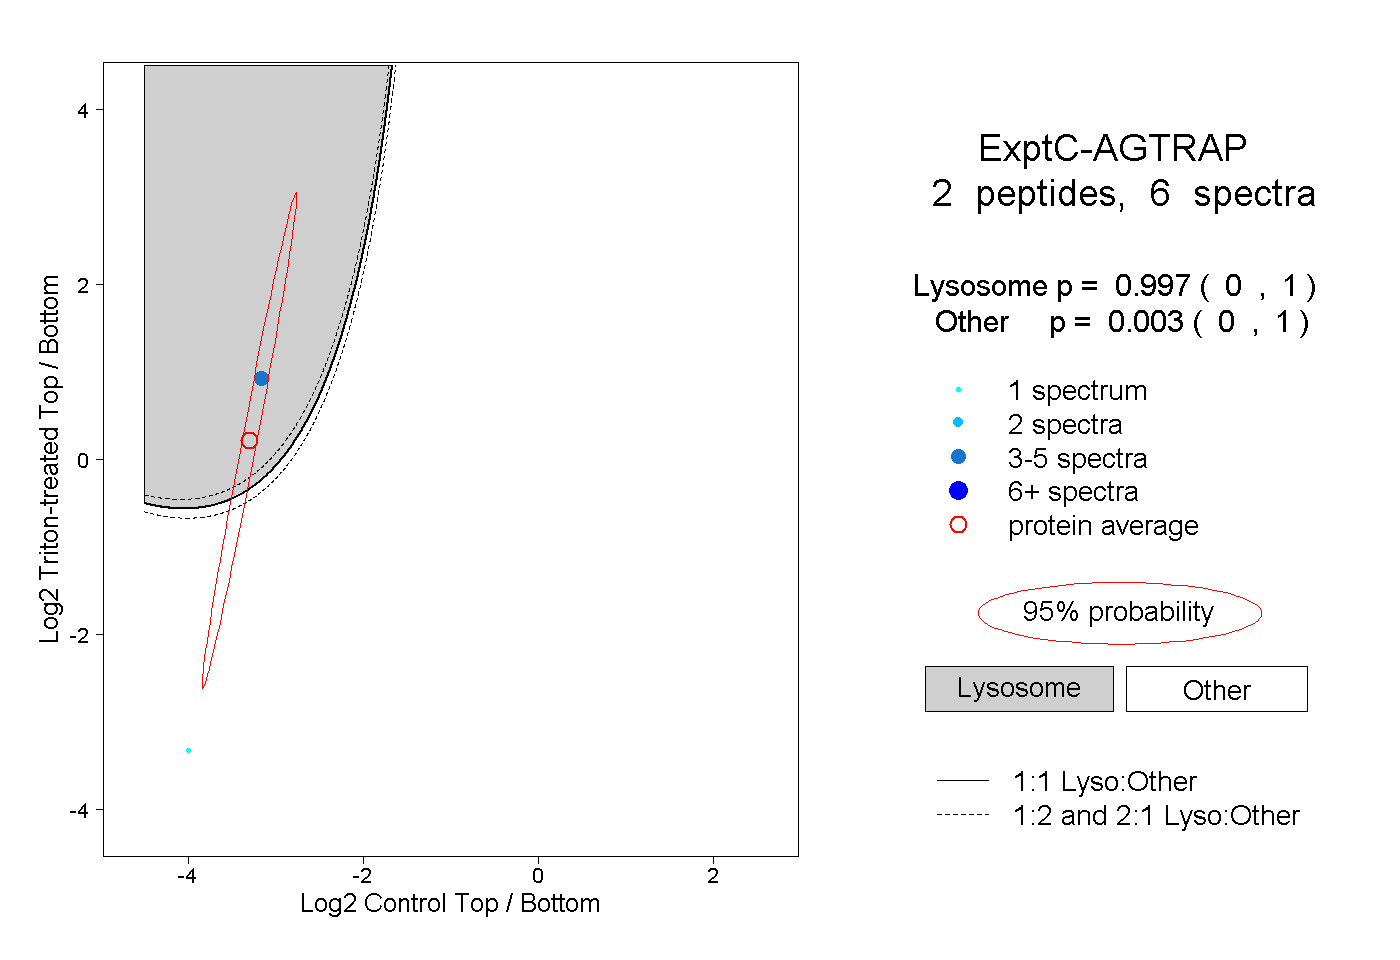 |
0.997 0.000 | 1.000 |
0.003 0.000 | 1.000 |