18
18peptides
spectra
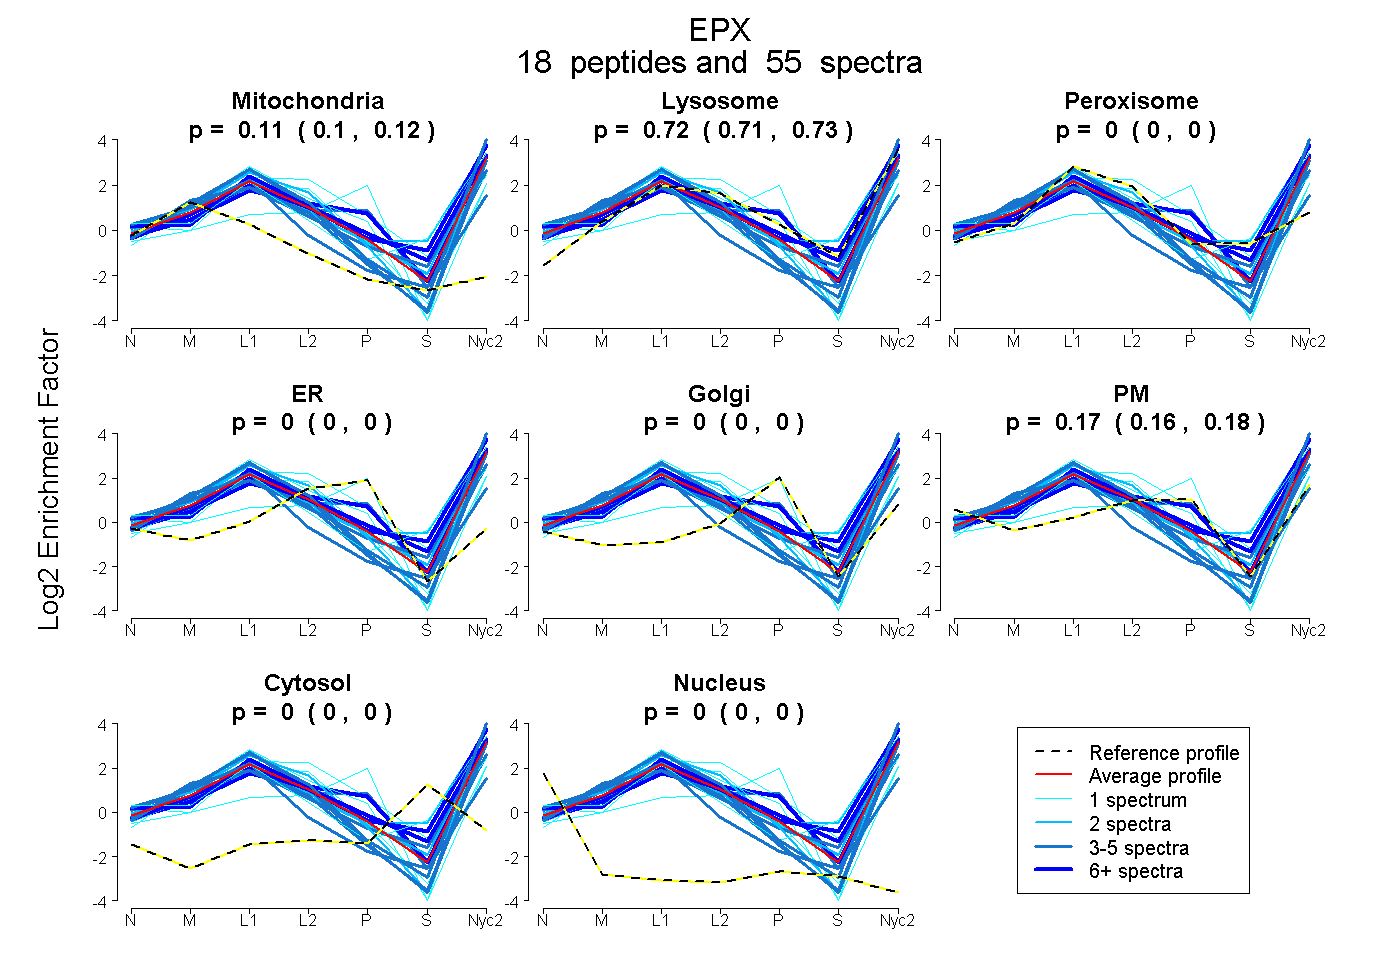
0.105 | 0.119
0.706 | 0.725
0.000 | 0.000
0.000 | 0.000
0.000 | 0.000
0.157 | 0.182
0.000 | 0.000
0.000 | 0.000
13peptides
spectra
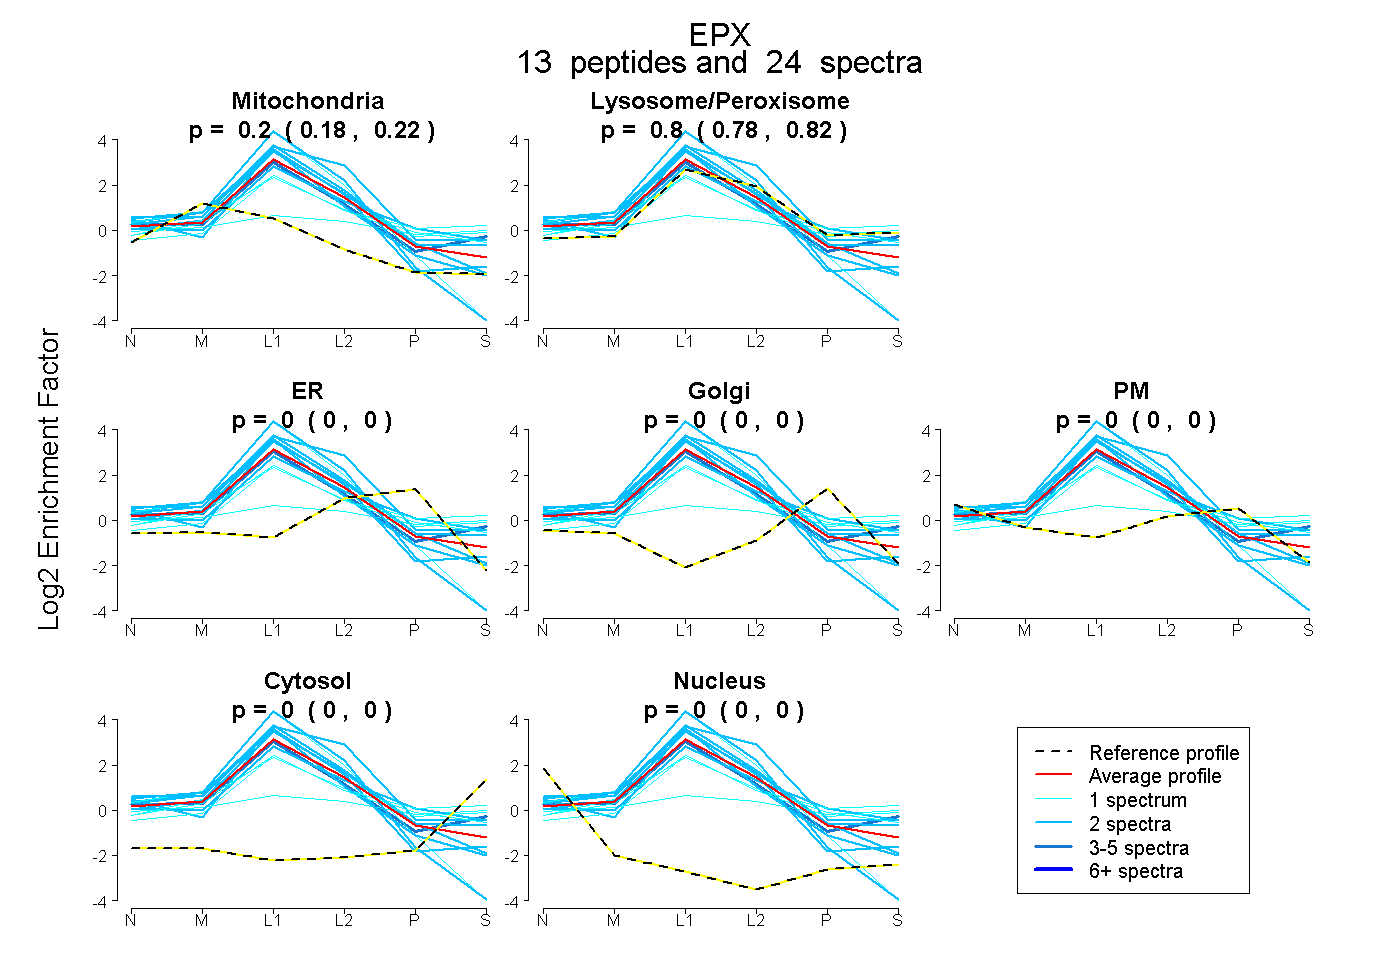
0.180 | 0.219
0.776 | 0.816
0.000 | 0.000
0.000 | 0.000
0.000 | 0.000
0.000 | 0.000
0.000 | 0.000
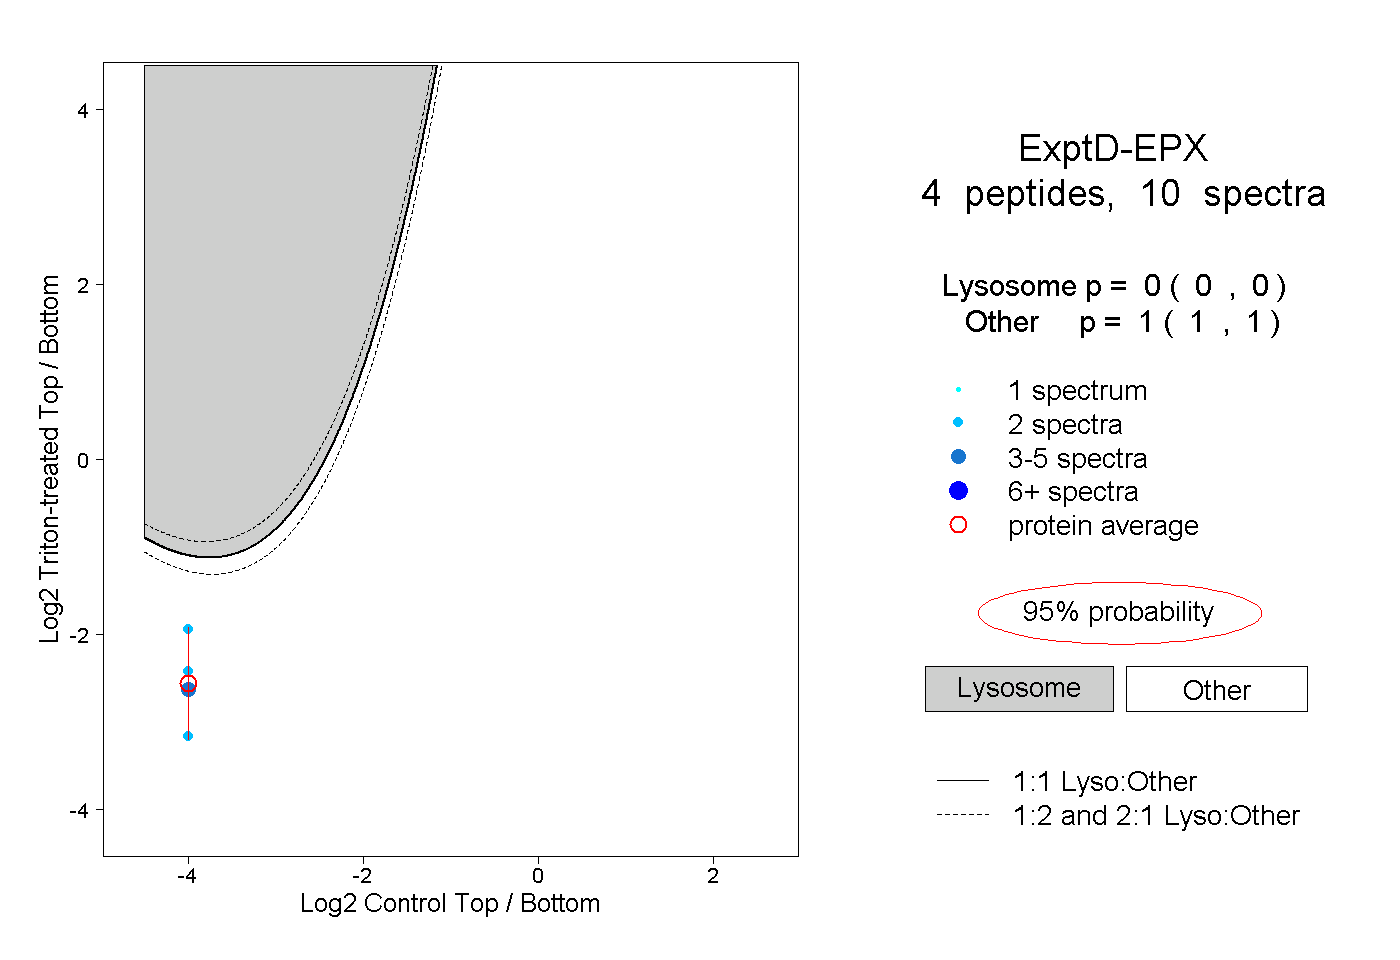
22peptides
spectra
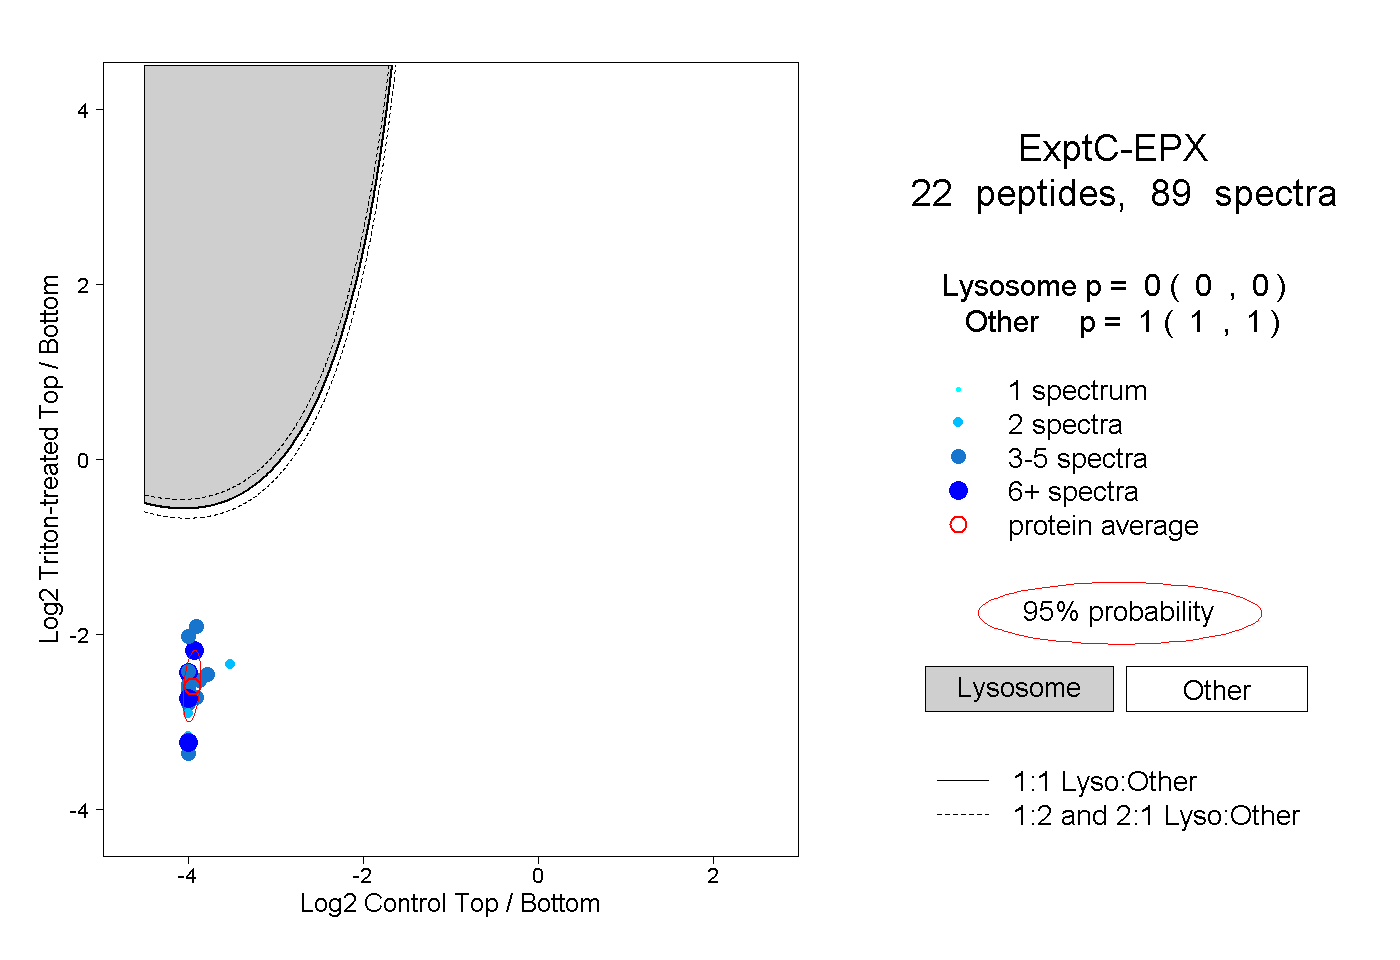
0.000 | 0.000
1.000 | 1.000