 3
3peptides
spectra
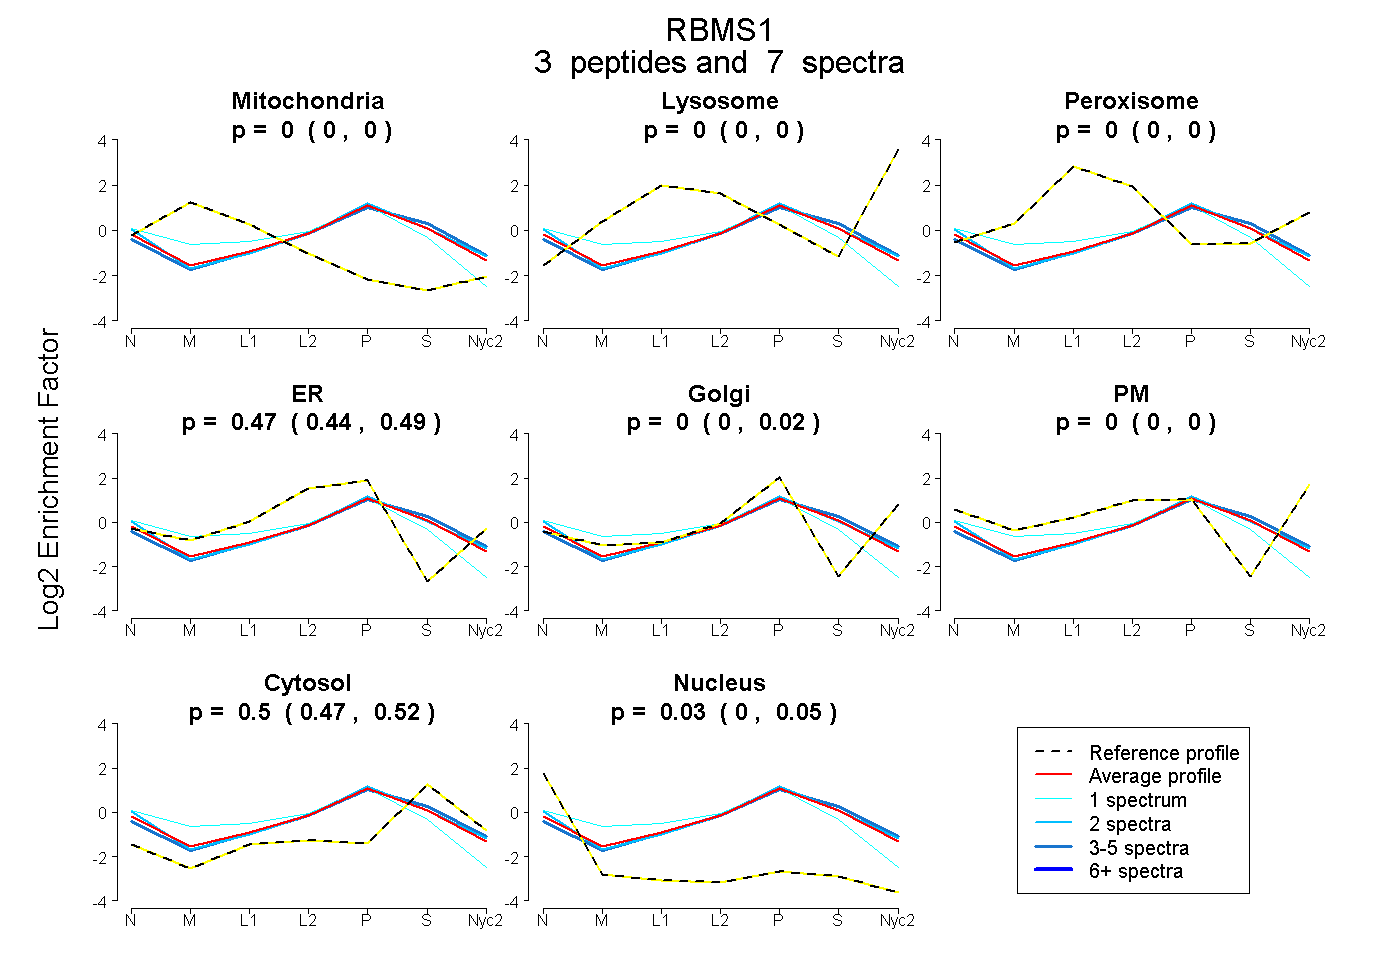
0.000 | 0.000
0.000 | 0.000
0.000 | 0.000
0.443 | 0.492
0.000 | 0.019
0.000 | 0.000
0.474 | 0.521
0.003 | 0.045
| Plot | Mito | Lyso | Perox | ER | Golgi | PM | Cytosol | Nucleus | |||||
| Expt A |
3 peptides |
7 spectra |
|
0.000 0.000 | 0.000 |
0.000 0.000 | 0.000 |
0.000 0.000 | 0.000 |
0.474 0.443 | 0.492 |
0.000 0.000 | 0.019 |
0.000 0.000 | 0.000 |
0.500 0.474 | 0.521 |
0.026 0.003 | 0.045 |
| 1 spectrum, TPPGVSAPTEPLLCK | 0.116 | 0.000 | 0.000 | 0.489 | 0.000 | 0.000 | 0.318 | 0.078 | ||
| 2 spectra, LCQPYGK | 0.000 | 0.000 | 0.000 | 0.452 | 0.037 | 0.000 | 0.480 | 0.031 | ||
| 4 spectra, ASGVQAQMAK | 0.000 | 0.000 | 0.000 | 0.429 | 0.013 | 0.000 | 0.558 | 0.000 |
| Plot | Lyso | Other | |||||||||||
| Expt C |
6 peptides |
14 spectra |
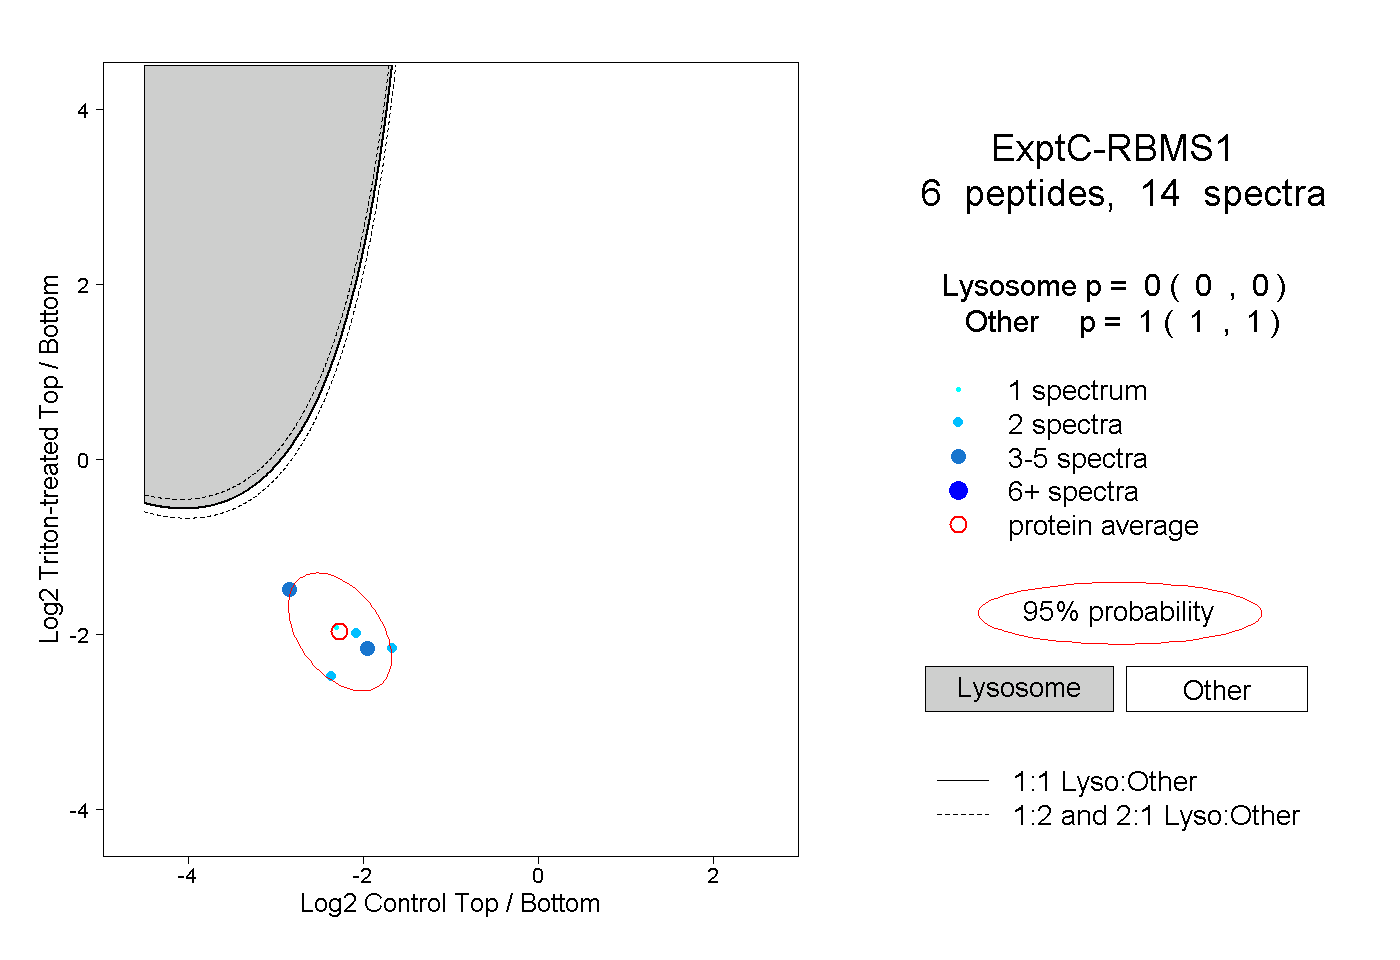 |
0.000 0.000 | 0.000 |
1.000 1.000 | 1.000 |