 3
3peptides
spectra
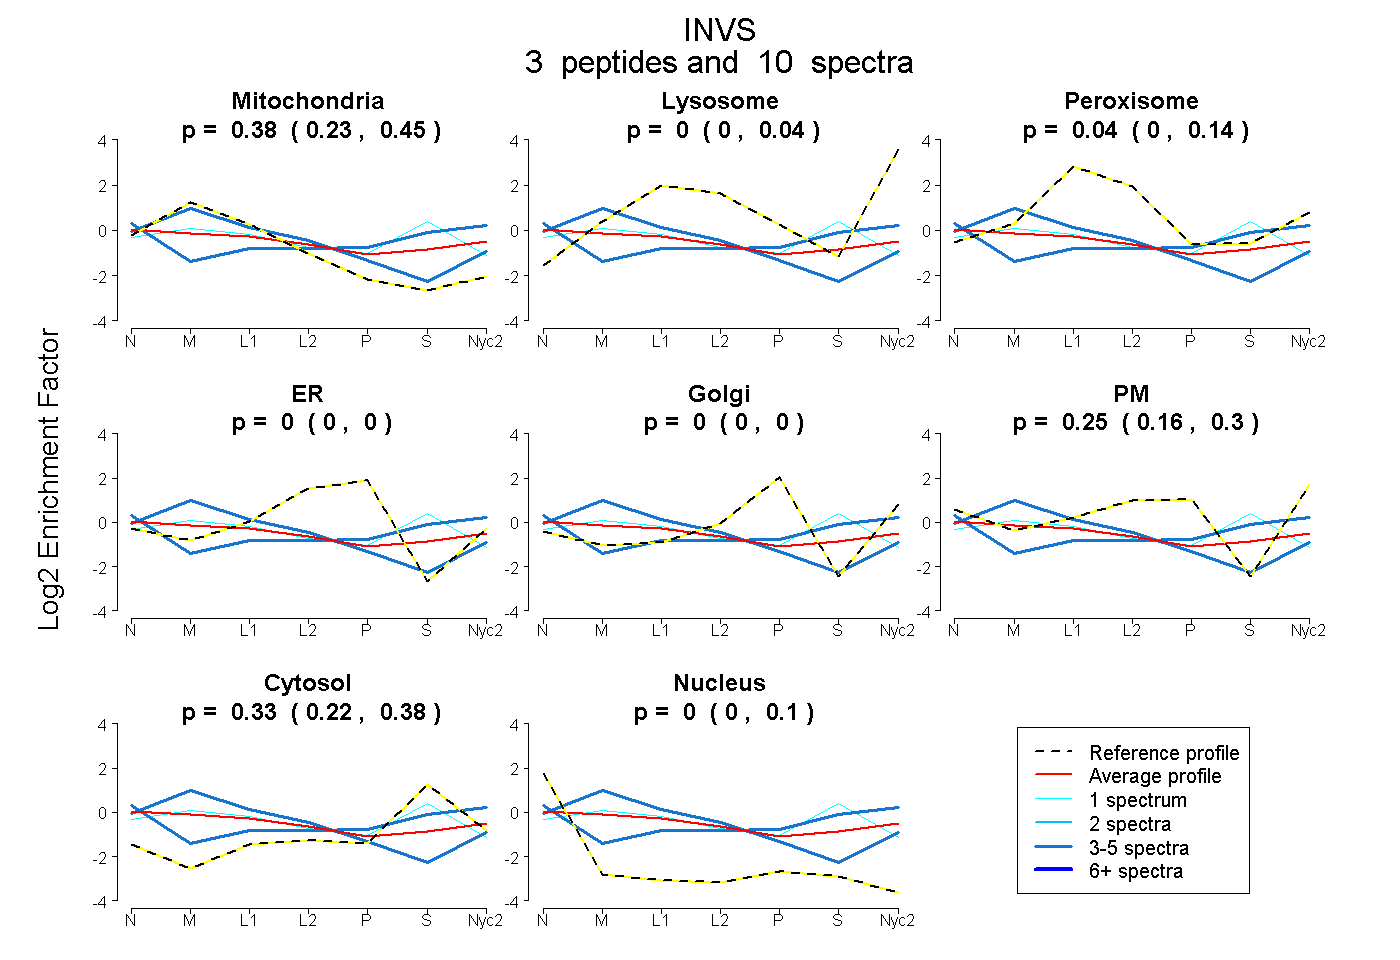
0.228 | 0.449
0.000 | 0.043
0.000 | 0.142
0.000 | 0.000
0.000 | 0.000
0.158 | 0.300
0.221 | 0.378
0.000 | 0.098
1peptide
spectrum
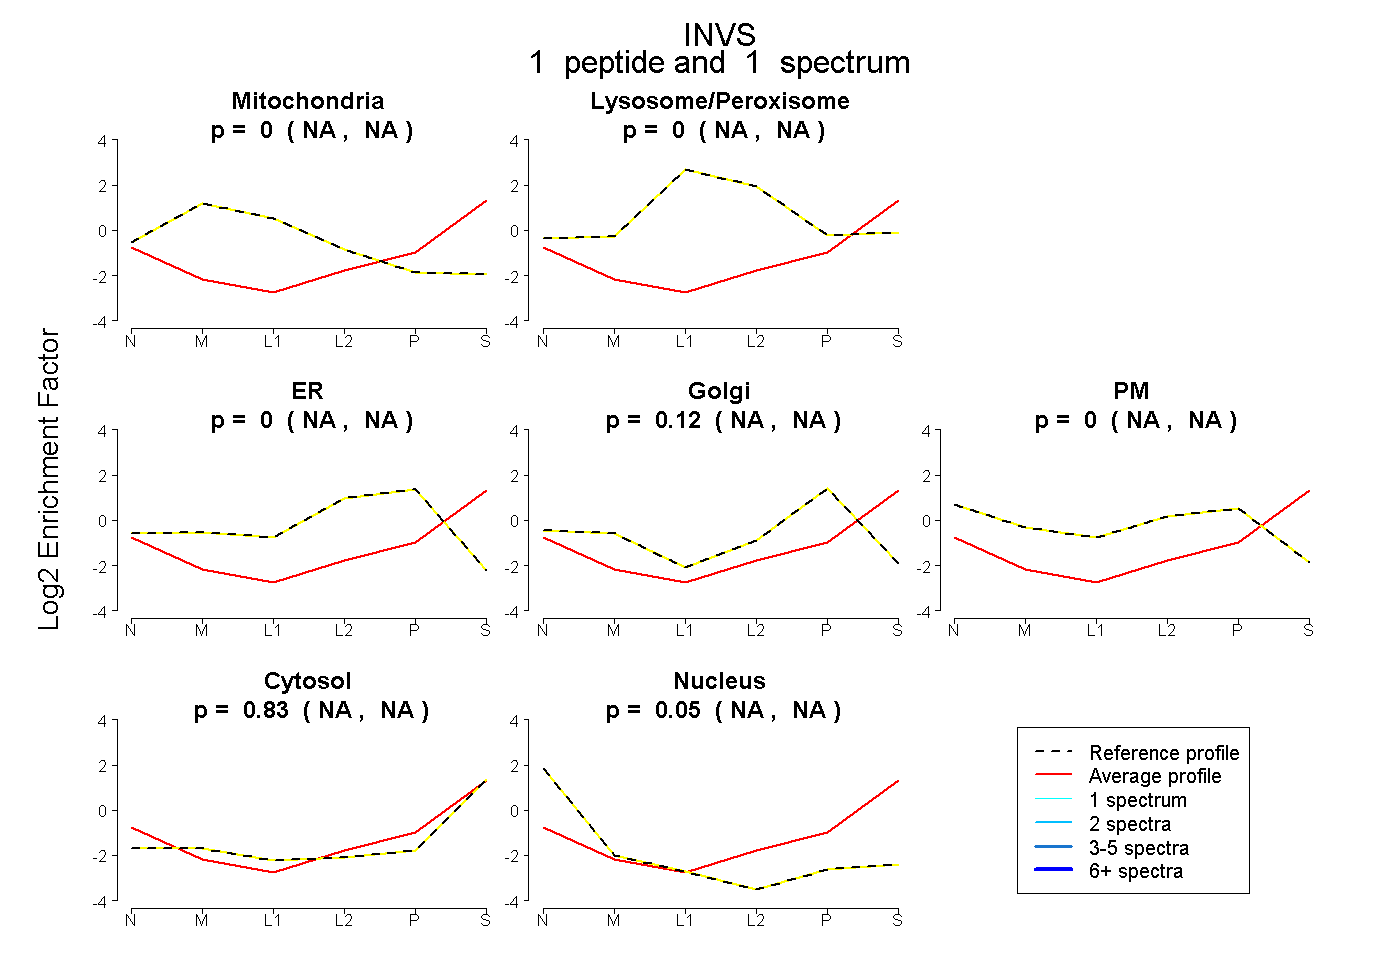
NA | NA
NA | NA
NA | NA
NA | NA
NA | NA
NA | NA
NA | NA
4peptides
spectra
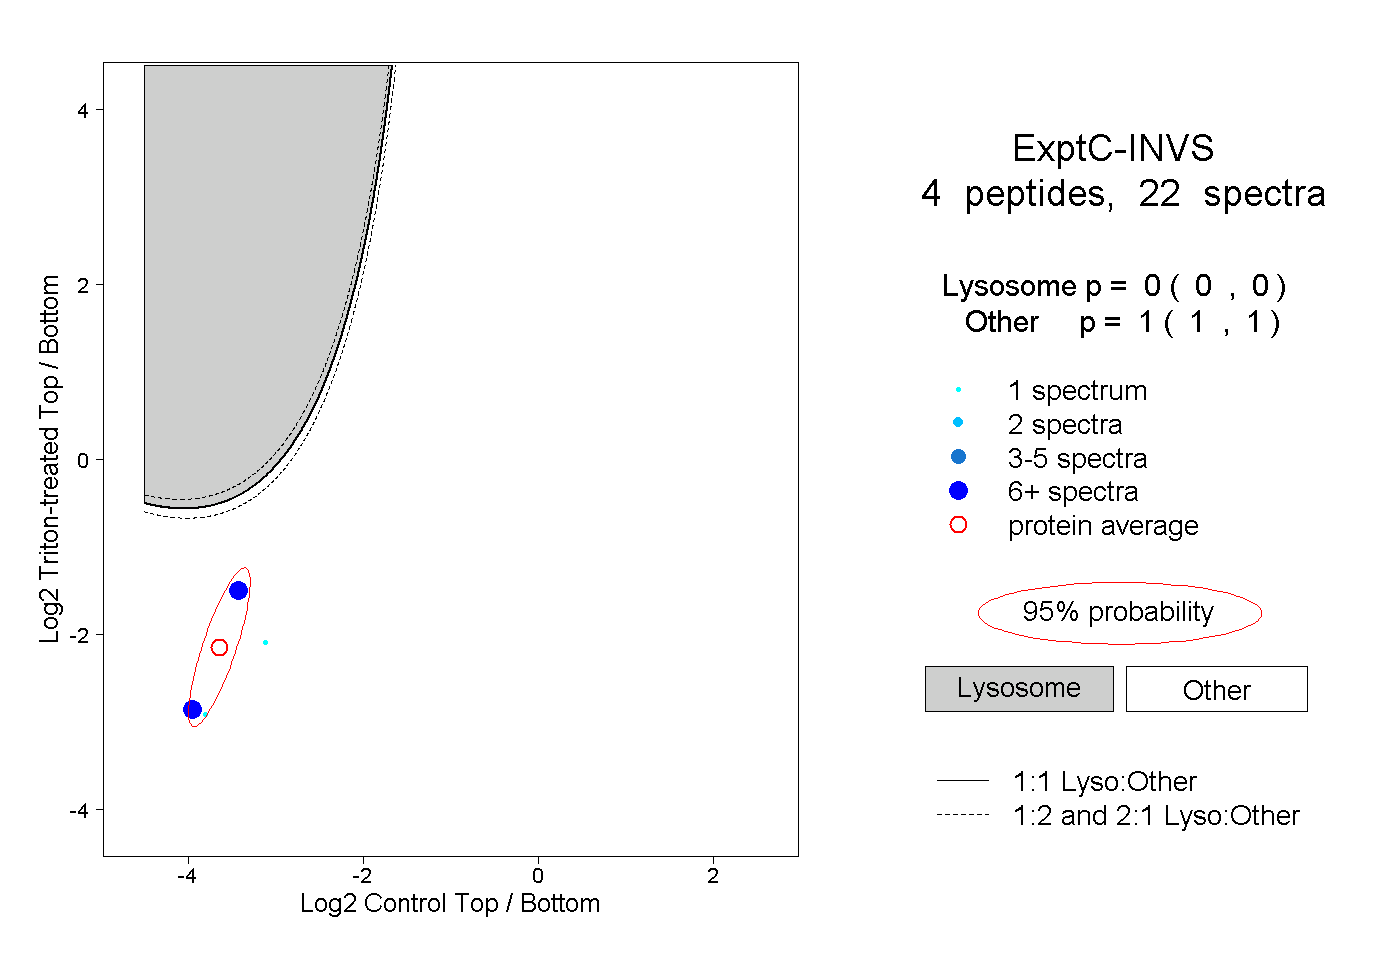
0.000 | 0.000
1.000 | 1.000
1peptide
spectra
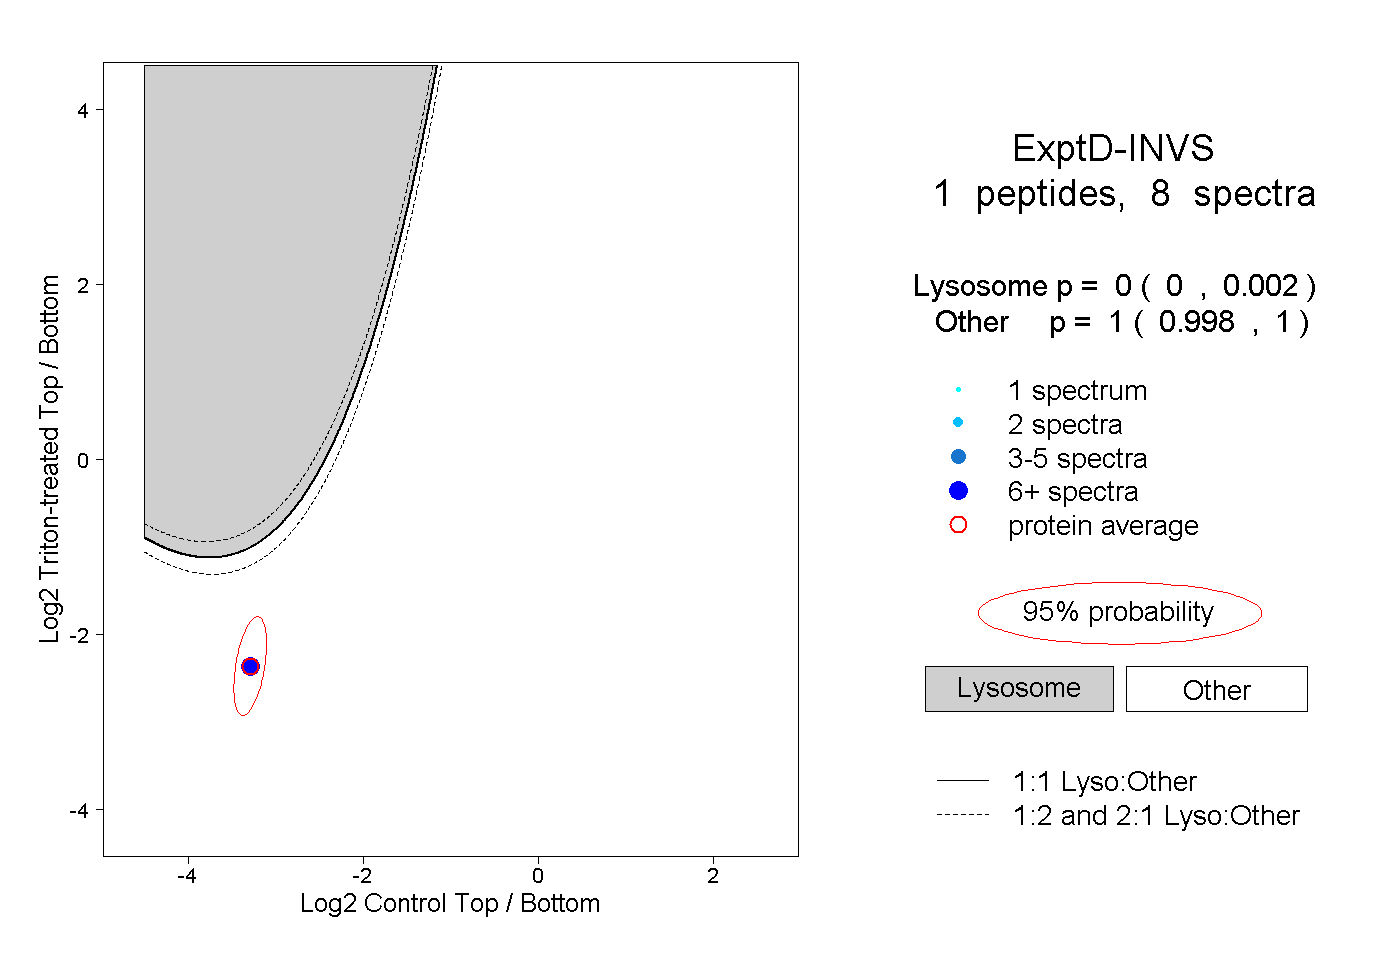
0.000 | 0.002
0.998 | 1.000