INVS
[ENSRNOP00000011622]
Main page
| | | Plot |
Mito |
Lyso |
|
Perox |
ER |
Golgi |
PM |
Cytosol |
Nucleus |
|
| Expt A |
 3
3
peptides |
10
spectra |
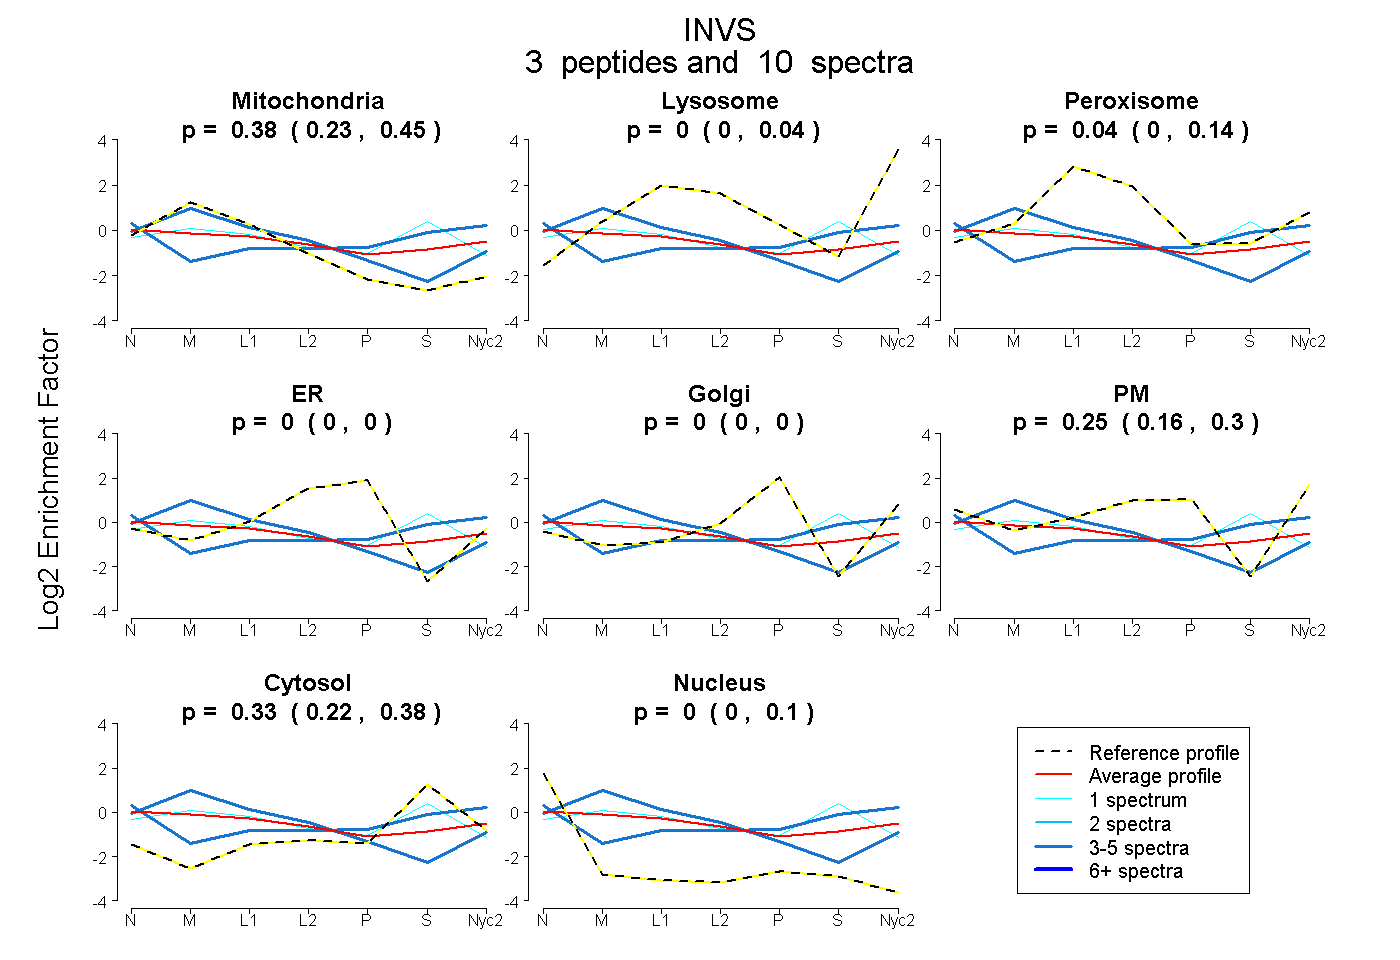 |
0.380
0.228 | 0.449 |
0.000
0.000 | 0.043 |
|
0.044
0.000 | 0.142 |
0.000
0.000 | 0.000 |
0.000
0.000 | 0.000 |
0.247
0.158 | 0.300 |
0.325
0.221 | 0.378 |
0.004
0.000 | 0.098 |
|
| | | Plot |
Mito |
|
Lyso or Perox |
|
ER |
Golgi |
PM |
Cytosol |
Nucleus |
|
| Expt B |
1
peptide |
1
spectrum |
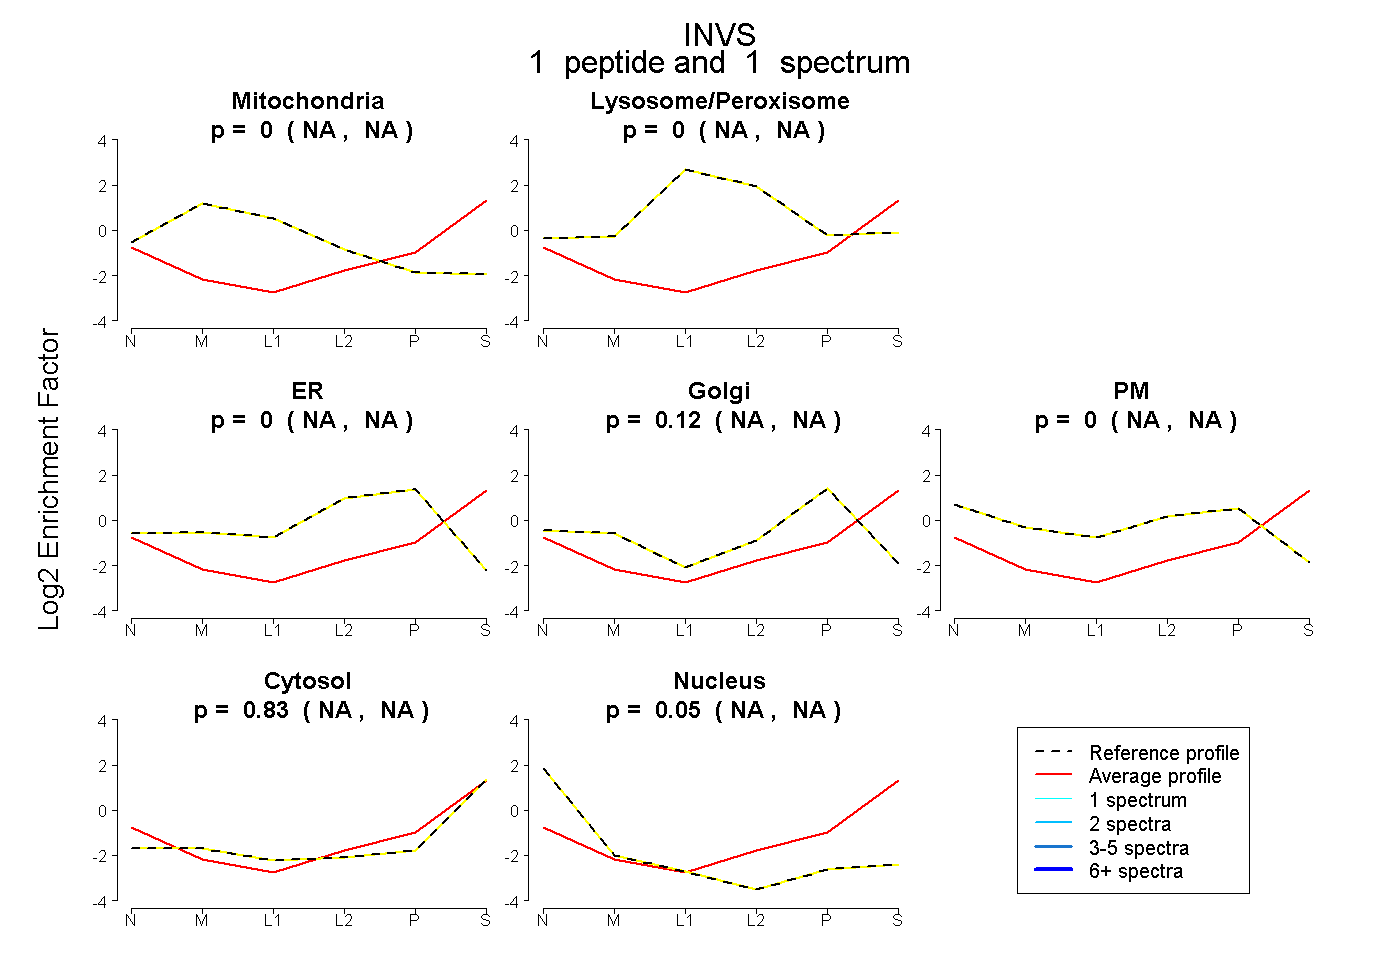 |
0.000
NA | NA |
|
0.000
NA | NA |
|
0.000
NA | NA |
0.119
NA | NA |
0.000
NA | NA |
0.831
NA | NA |
0.050
NA | NA |
|
| | | Plot |
|
Lyso |
|
|
|
|
|
|
|
Other |
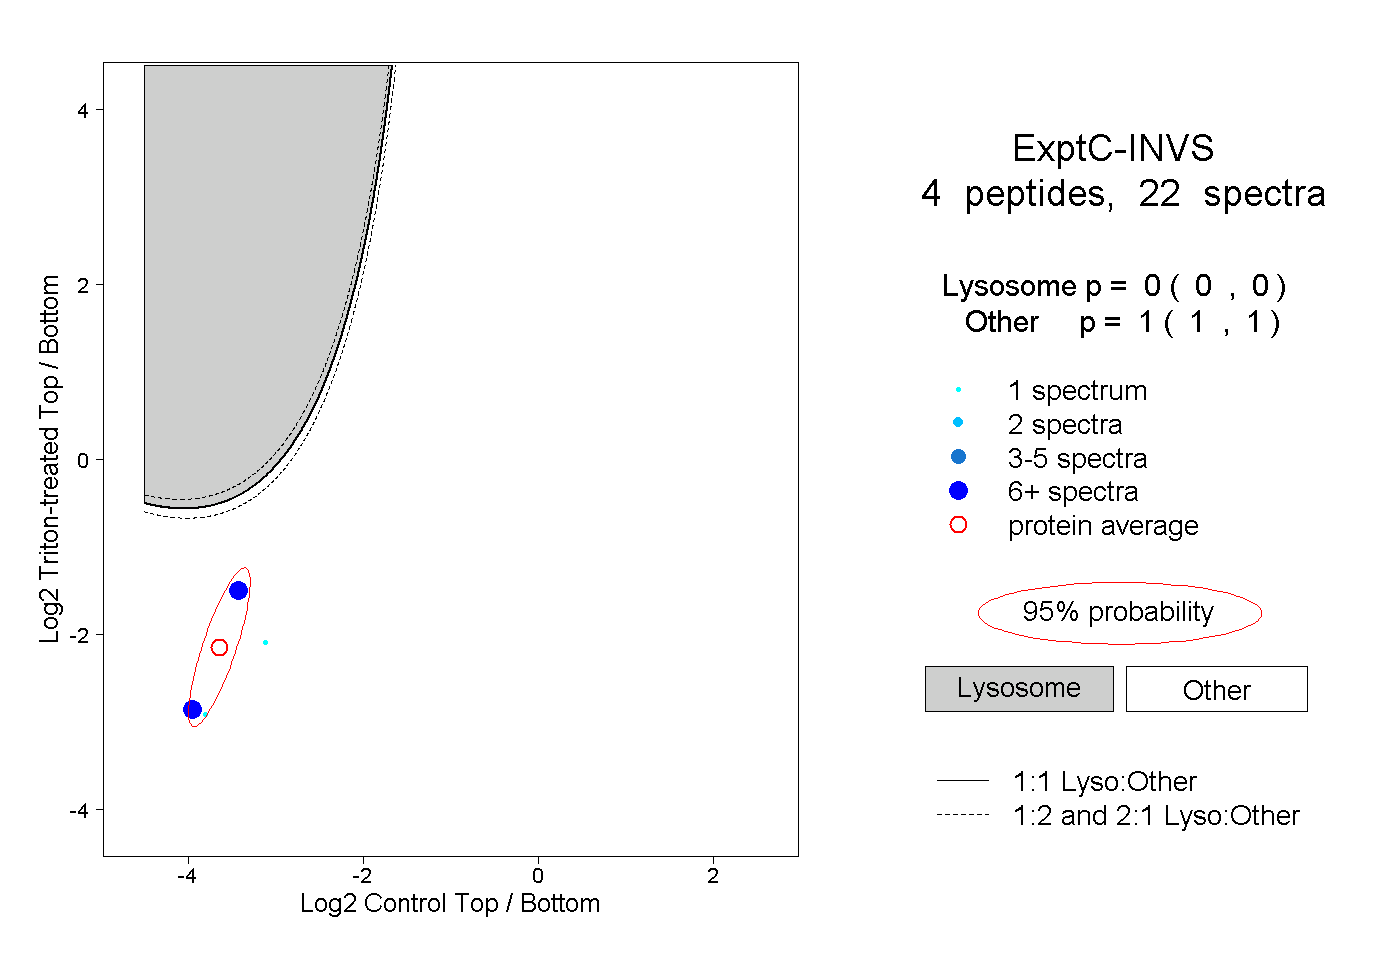
| Expt C |
4
peptides |
22
spectra |
 |
|
0.000
0.000 | 0.000 |
|
|
|
|
|
|
|
1.000
1.000 | 1.000 |
| 9 spectra, HTPLFR |
|
0.000 |
|
|
|
|
|
|
|
1.000 |
| 1 spectrum, AGADVNK |
|
0.000 |
|
|
|
|
|
|
|
1.000 |
| 11 spectra, LLLTR |
|
0.000 |
|
|
|
|
|
|
|
1.000 |
| 1 spectrum, IQAVYK |
|
0.000 |
|
|
|
|
|
|
|
1.000 |
| | | Plot |
|
Lyso |
|
|
|
|
|
|
|
Other |
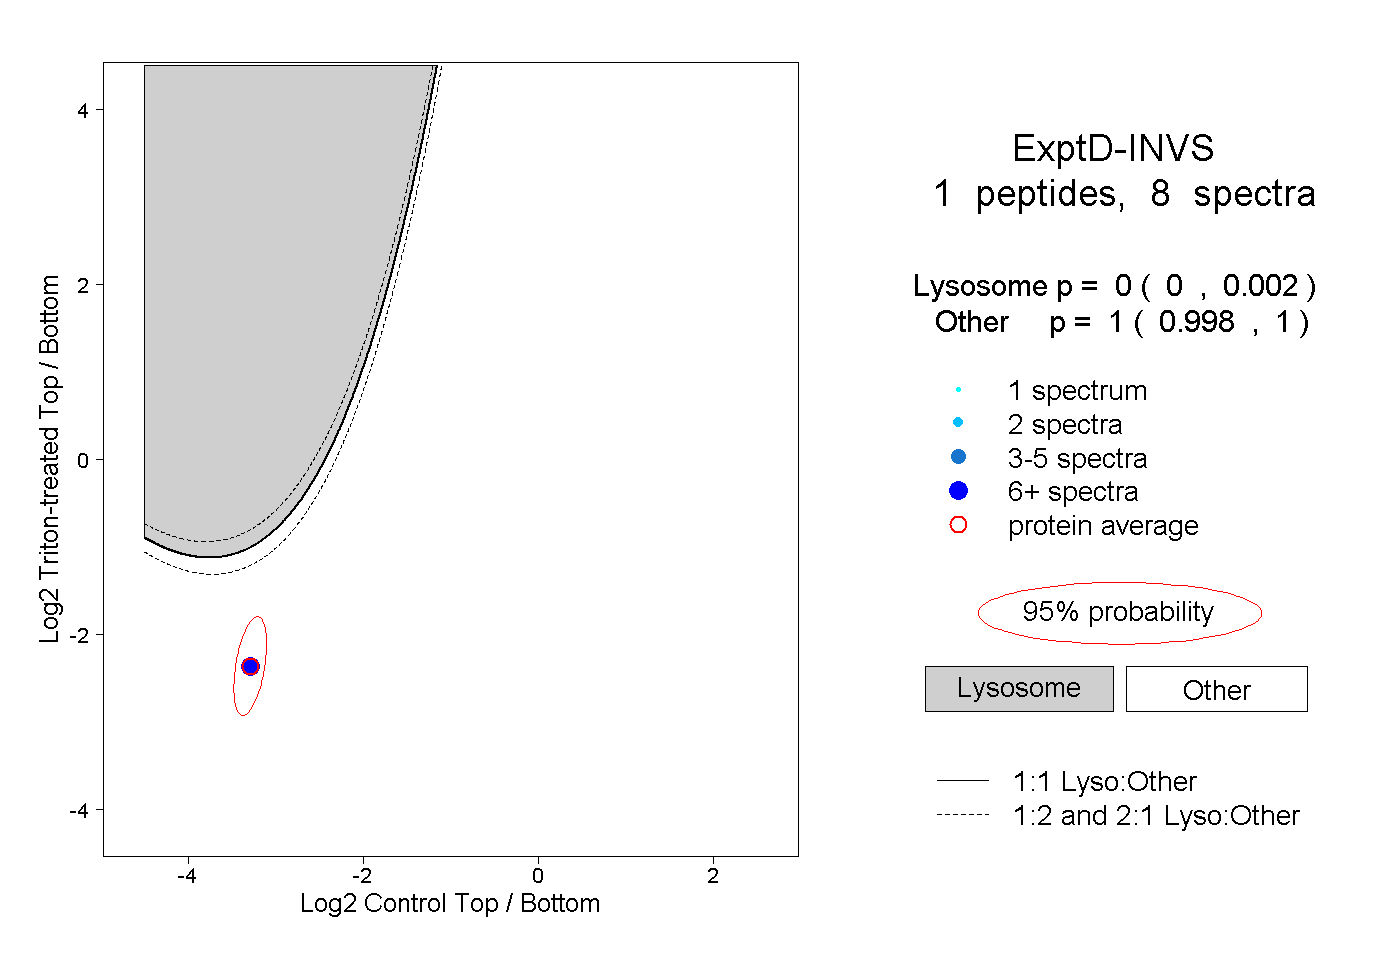
| Expt D |
1
peptide |
8
spectra |
 |
|
0.000
0.000 | 0.002 |
|
|
|
|
|
|
|
1.000
0.998 | 1.000 |