 5
5peptides
spectra
0.575 | 0.690
0.000 | 0.000
0.024 | 0.134
0.118 | 0.257
0.000 | 0.000
0.000 | 0.000
0.051 | 0.105
0.000 | 0.000
| Plot | Mito | Lyso | Perox | ER | Golgi | PM | Cytosol | Nucleus | |||||
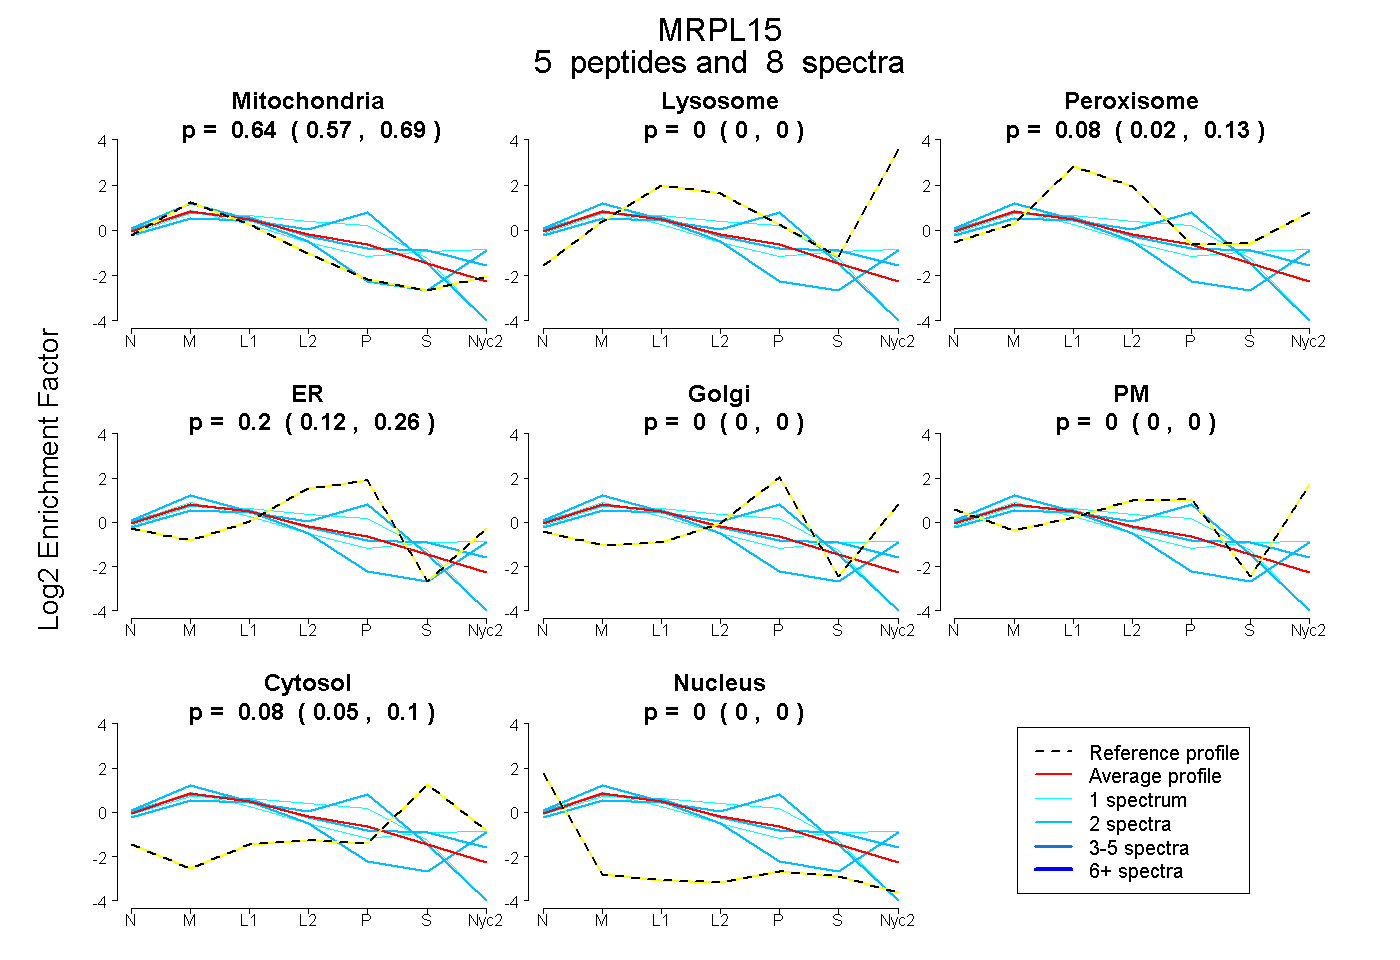
| Expt A |
5 peptides |
8 spectra |
|
0.639 0.575 | 0.690 |
0.000 0.000 | 0.000 |
0.085 0.024 | 0.134 |
0.197 0.118 | 0.257 |
0.000 0.000 | 0.000 |
0.000 0.000 | 0.000 |
0.079 0.051 | 0.105 |
0.000 0.000 | 0.000 |
| 2 spectra, LQYLIDLGR | 0.839 | 0.114 | 0.000 | 0.000 | 0.000 | 0.046 | 0.000 | 0.000 | ||
| 1 spectrum, GTSLDLLR | 0.531 | 0.000 | 0.189 | 0.000 | 0.000 | 0.098 | 0.182 | 0.000 | ||
| 2 spectra, VSLANLKPSLNSR | 0.521 | 0.000 | 0.000 | 0.413 | 0.000 | 0.000 | 0.021 | 0.045 | ||
| 1 spectrum, DYGVQLVEEGADTFQAK | 0.623 | 0.000 | 0.000 | 0.336 | 0.000 | 0.000 | 0.041 | 0.000 | ||
| 2 spectra, YGFNEGHSFR | 0.535 | 0.000 | 0.223 | 0.089 | 0.000 | 0.000 | 0.152 | 0.000 |
| Plot | Mito | Lyso or Perox | ER | Golgi | PM | Cytosol | Nucleus | ||||||
| Expt B |
2 peptides |
3 spectra |
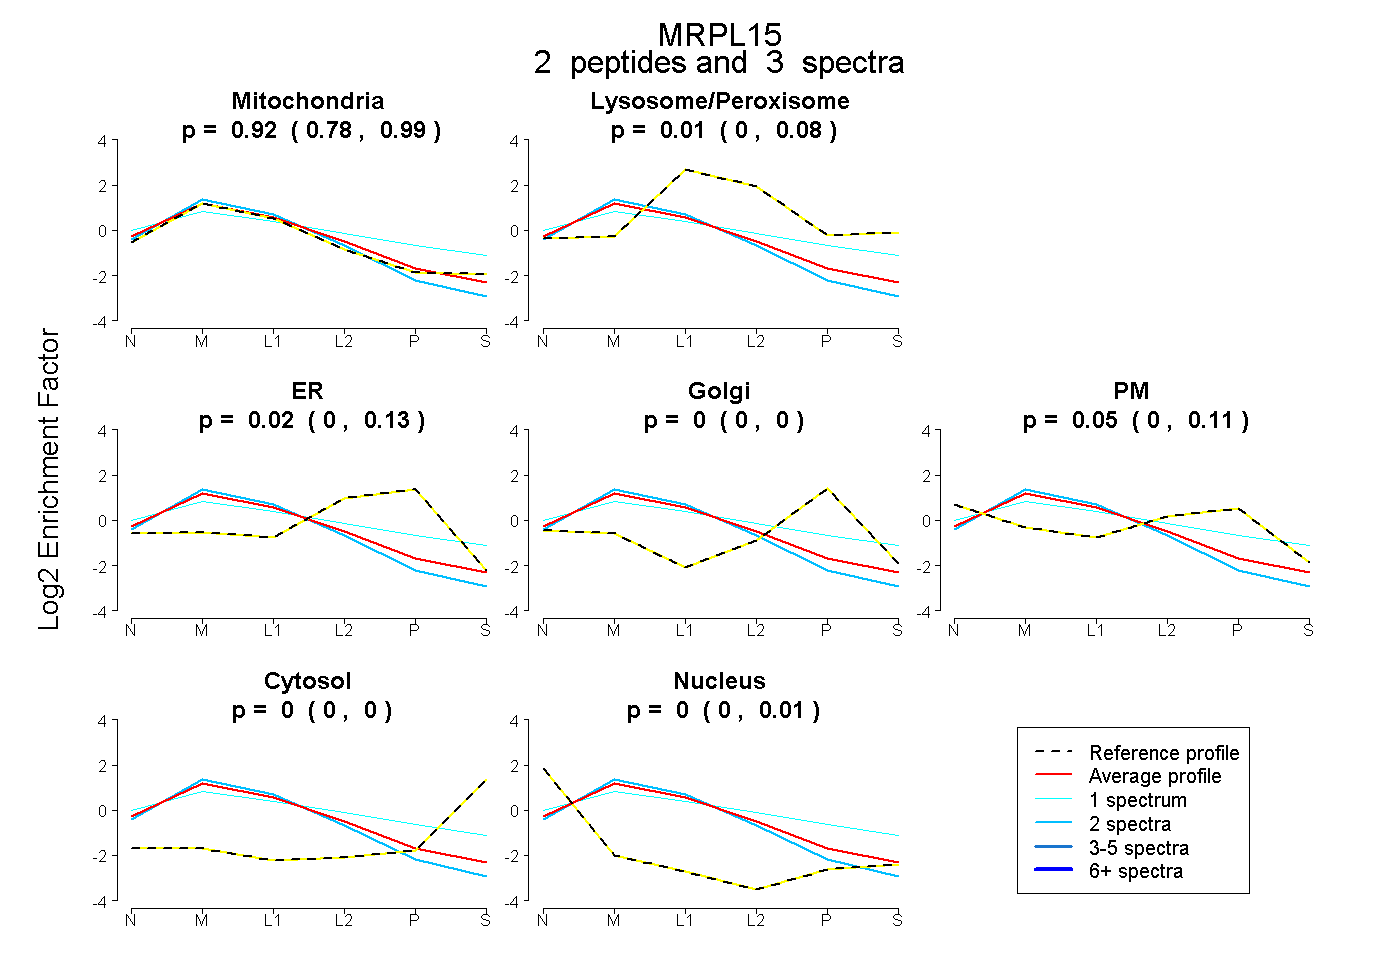 |
0.916 0.784 | 0.990 |
0.007 0.000 | 0.078 |
0.024 0.000 | 0.127 |
0.000 0.000 | 0.000 |
0.053 0.000 | 0.115 |
0.000 0.000 | 0.000 |
0.000 0.000 | 0.015 |
|||
| Plot | Lyso | Other | |||||||||||
| Expt C |
7 peptides |
34 spectra |
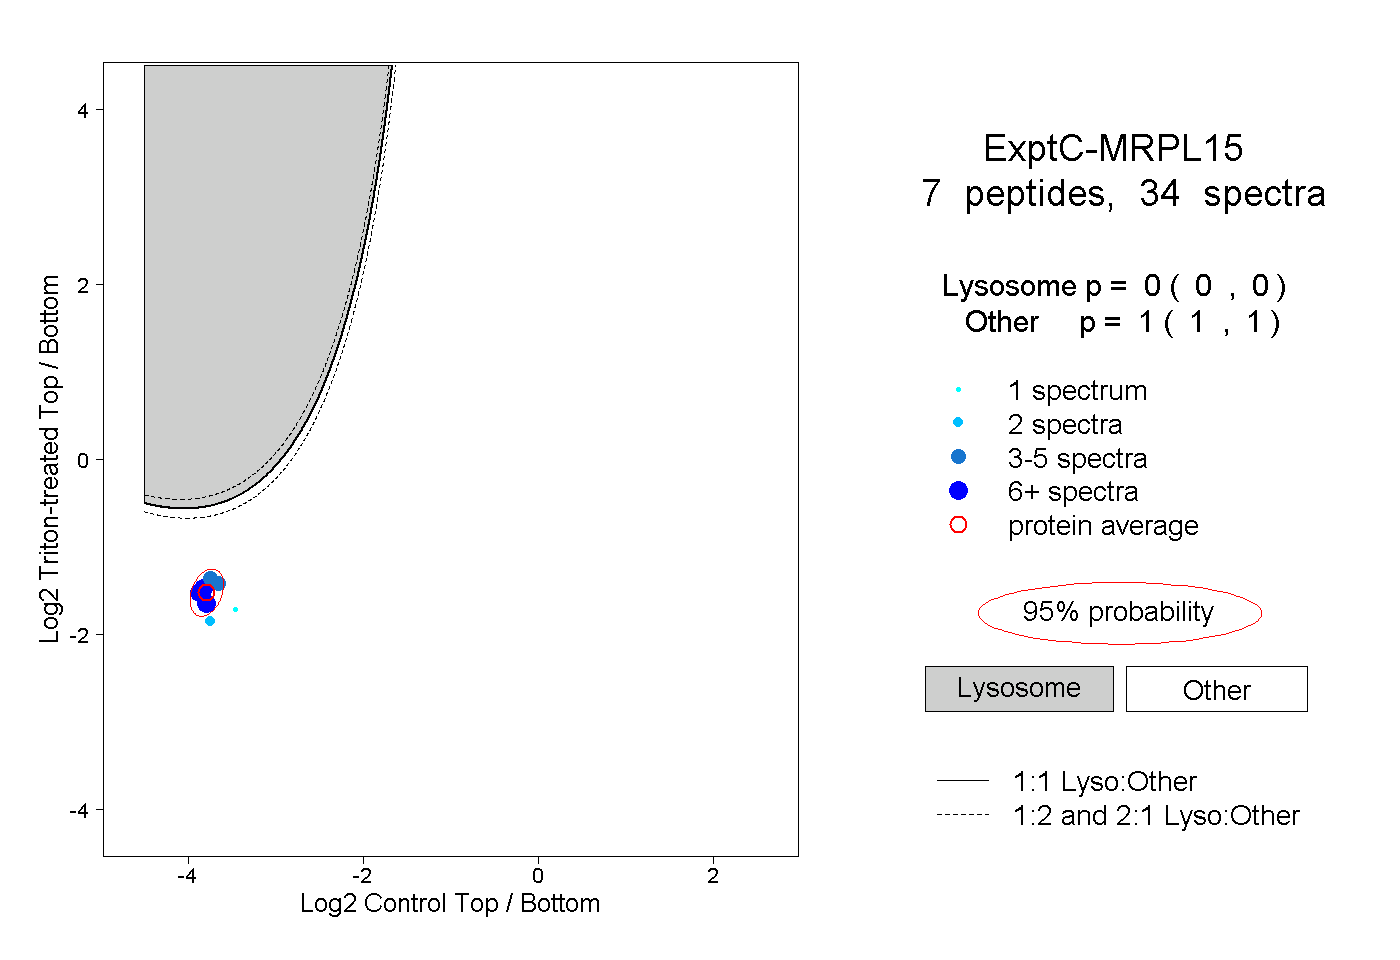 |
0.000 0.000 | 0.000 |
1.000 1.000 | 1.000 |
||||||||
| Plot | Lyso | Other | |||||||||||
| Expt D |
2 peptides |
3 spectra |
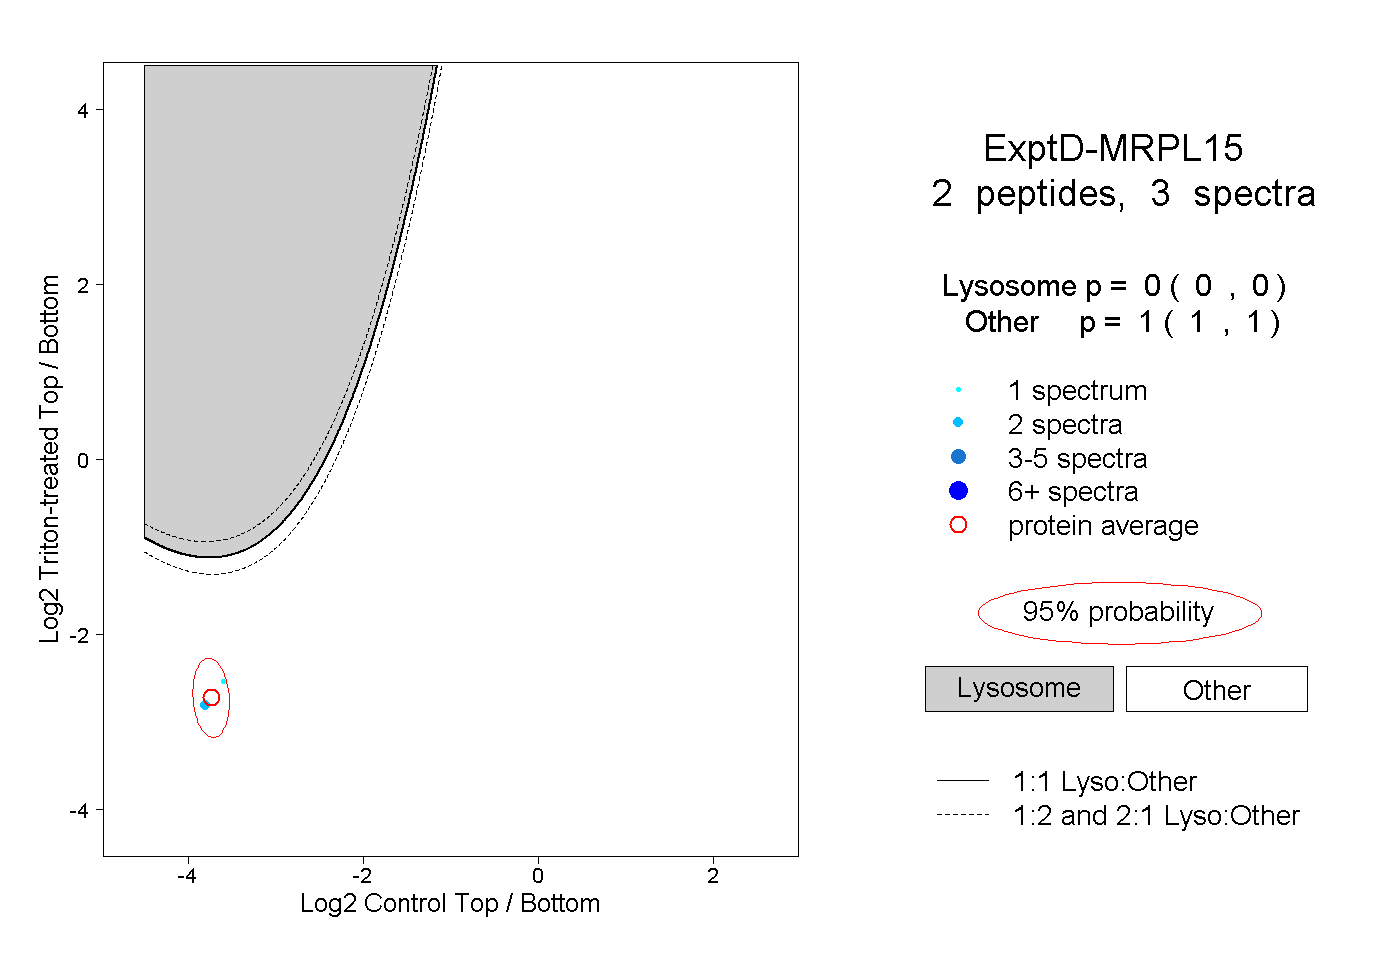 |
0.000 0.000 | 0.000 |
1.000 1.000 | 1.000 |