2
2peptides
spectra
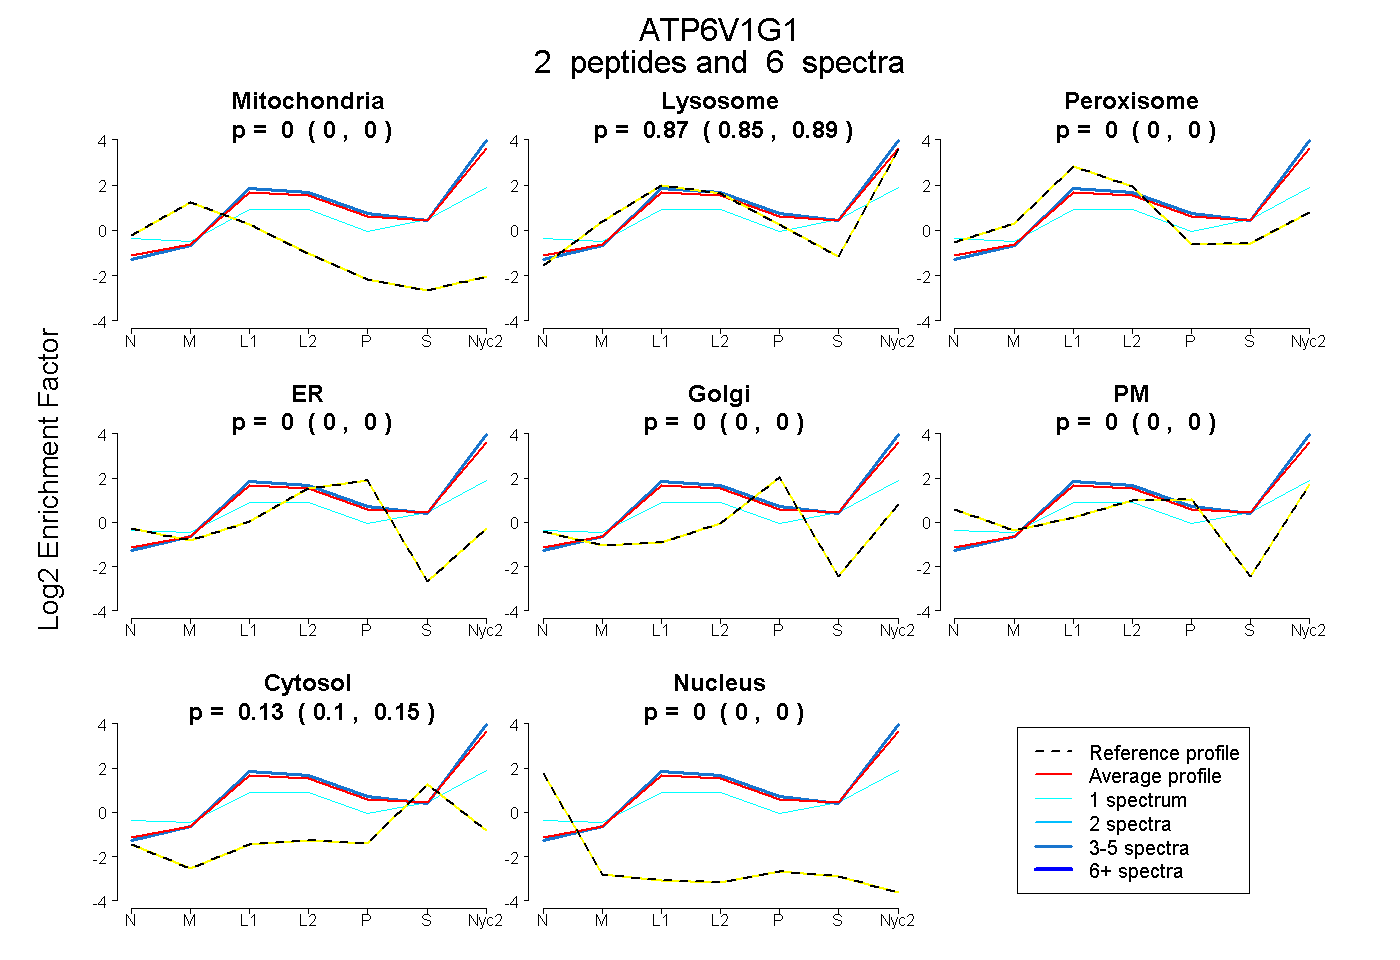
0.000 | 0.000
0.848 | 0.894
0.000 | 0.000
0.000 | 0.000
0.000 | 0.000
0.000 | 0.000
0.102 | 0.148
0.000 | 0.000
1peptide
spectra
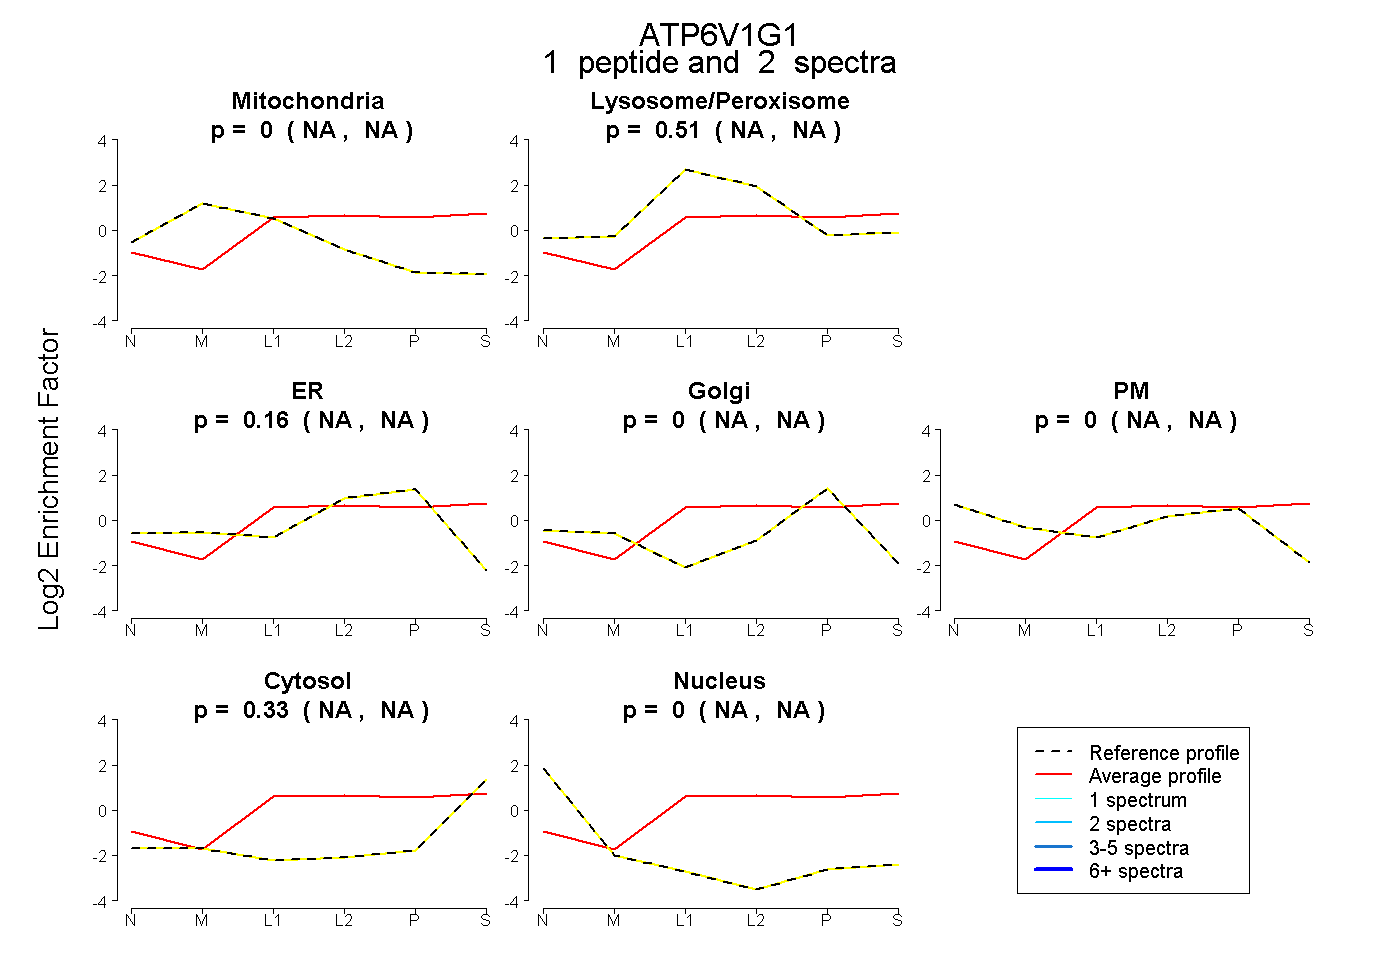
NA | NA
NA | NA
NA | NA
NA | NA
NA | NA
NA | NA
NA | NA
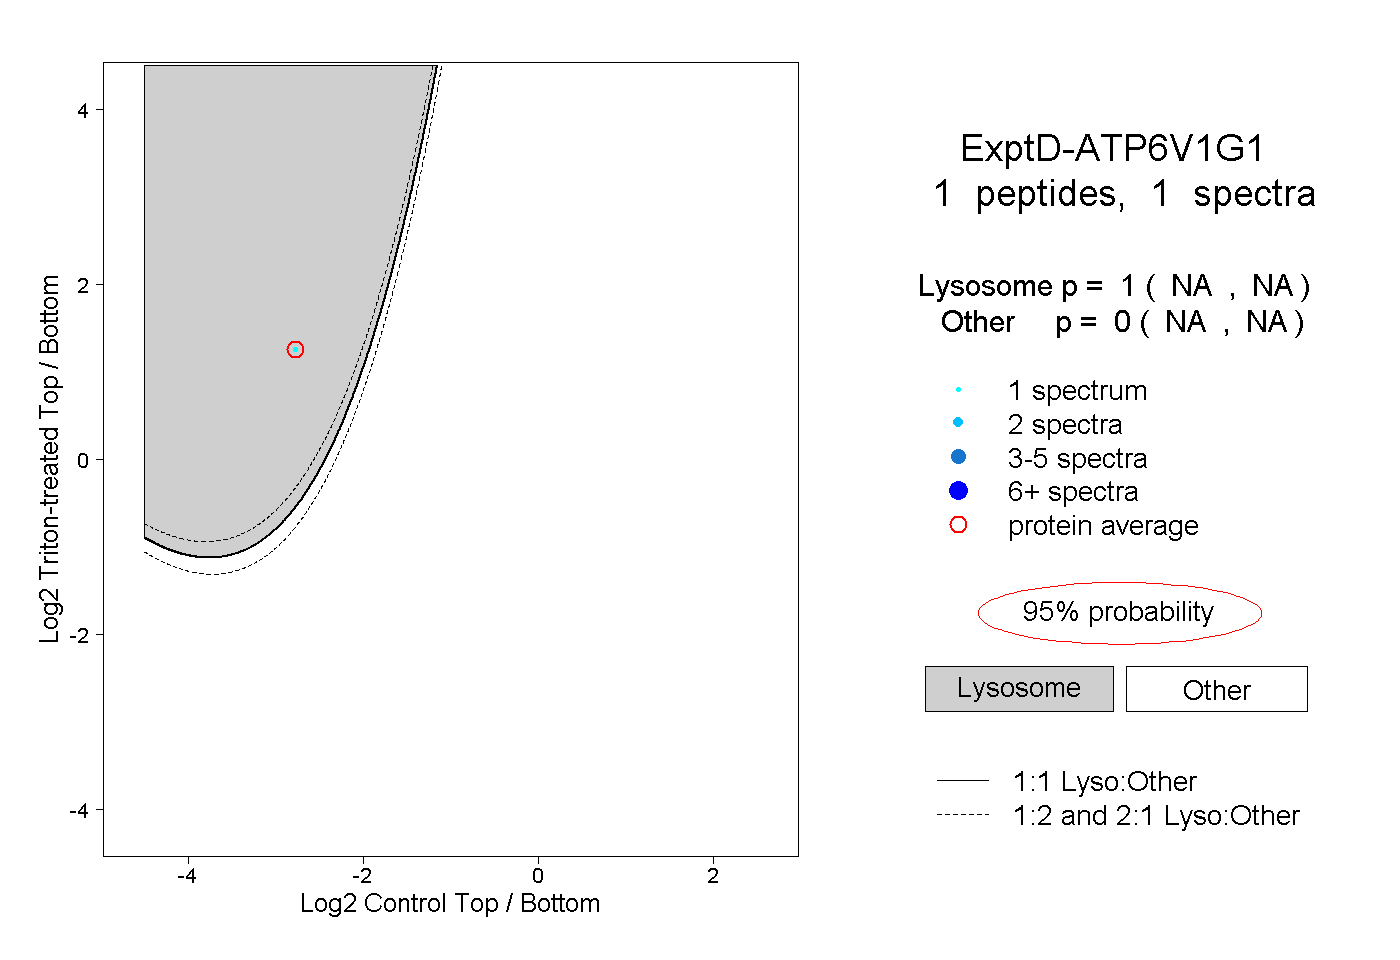
1peptide
spectra
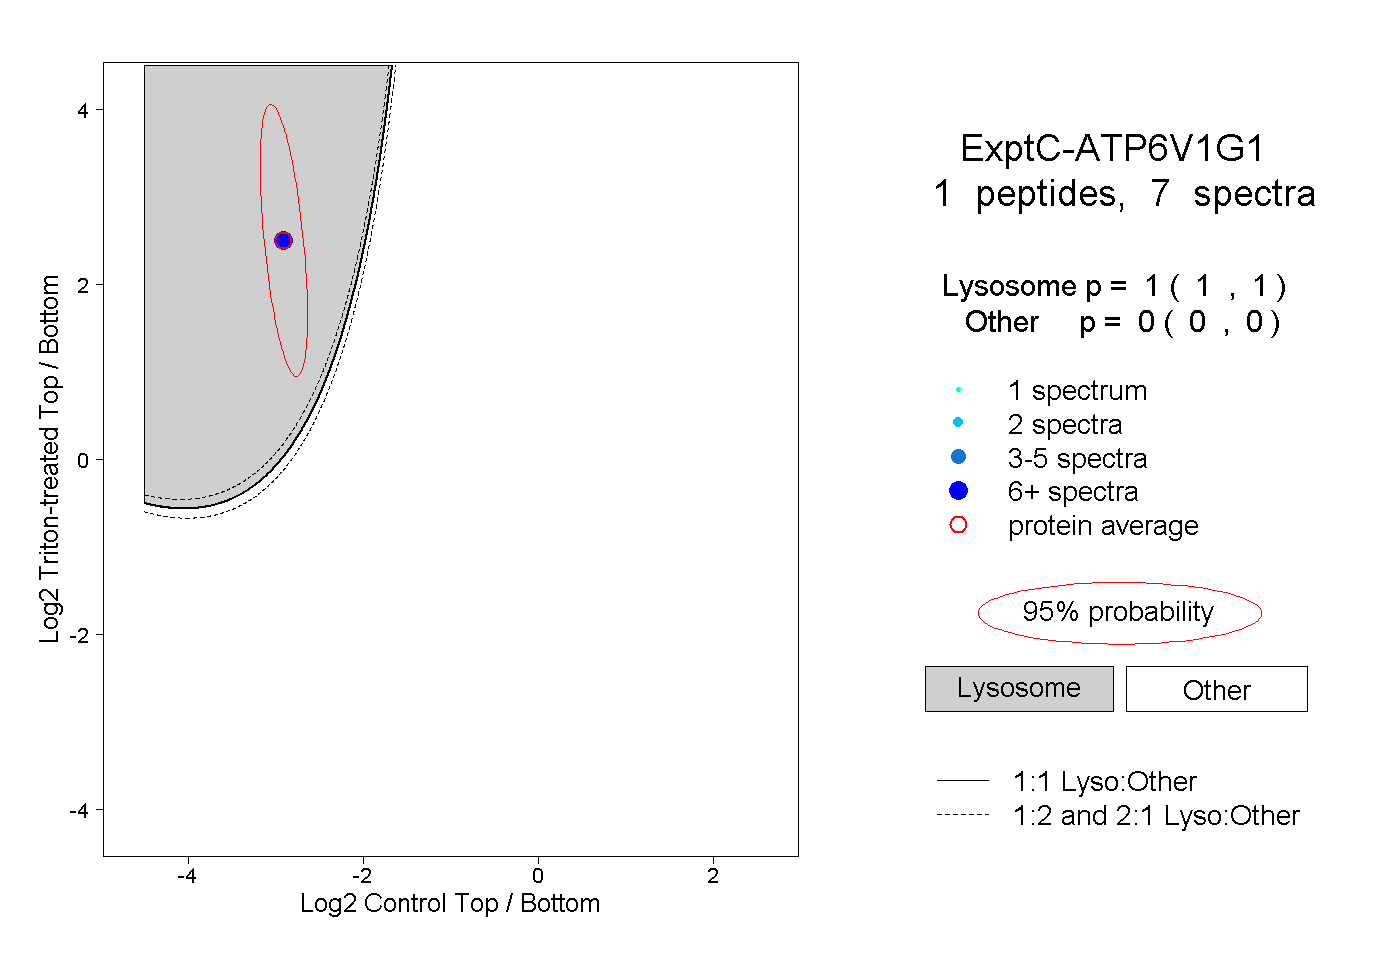
1.000 | 1.000
0.000 | 0.000