 3
3peptides
spectra
0.000 | 0.121
0.000 | 0.000
0.000 | 0.104
0.000 | 0.000
0.000 | 0.000
0.224 | 0.379
0.030 | 0.139
0.447 | 0.548
1peptide
spectrum
NA | NA
NA | NA
| Plot | Mito | Lyso | Perox | ER | Golgi | PM | Cytosol | Nucleus | |||||
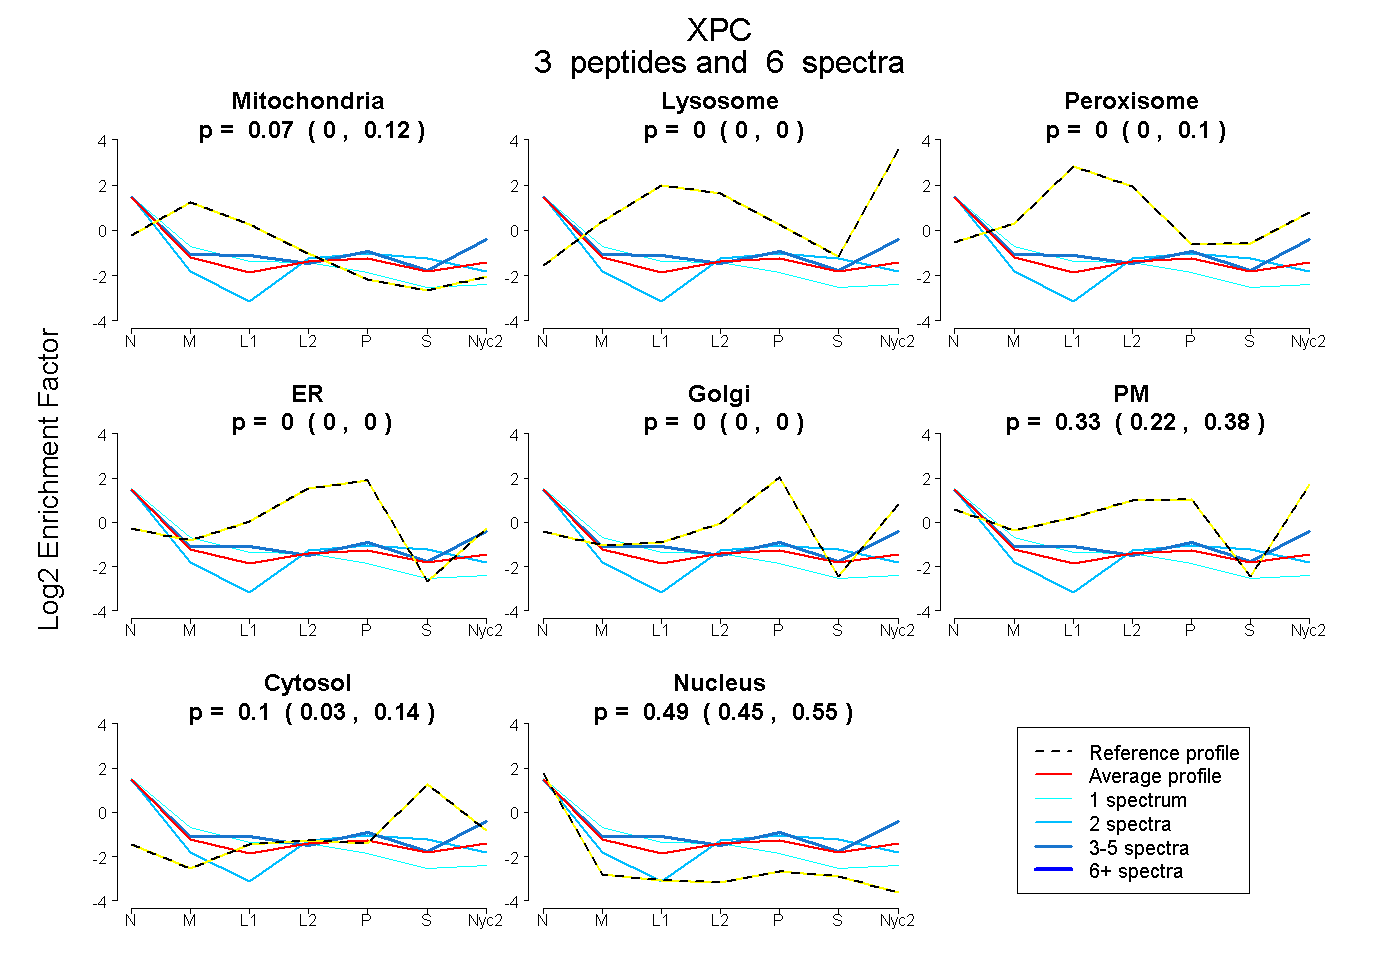
| Expt A |
3 peptides |
6 spectra |
|
0.072 0.000 | 0.121 |
0.000 0.000 | 0.000 |
0.000 0.000 | 0.104 |
0.000 0.000 | 0.000 |
0.000 0.000 | 0.000 |
0.333 0.224 | 0.379 |
0.100 0.030 | 0.139 |
0.494 0.447 | 0.548 |
||
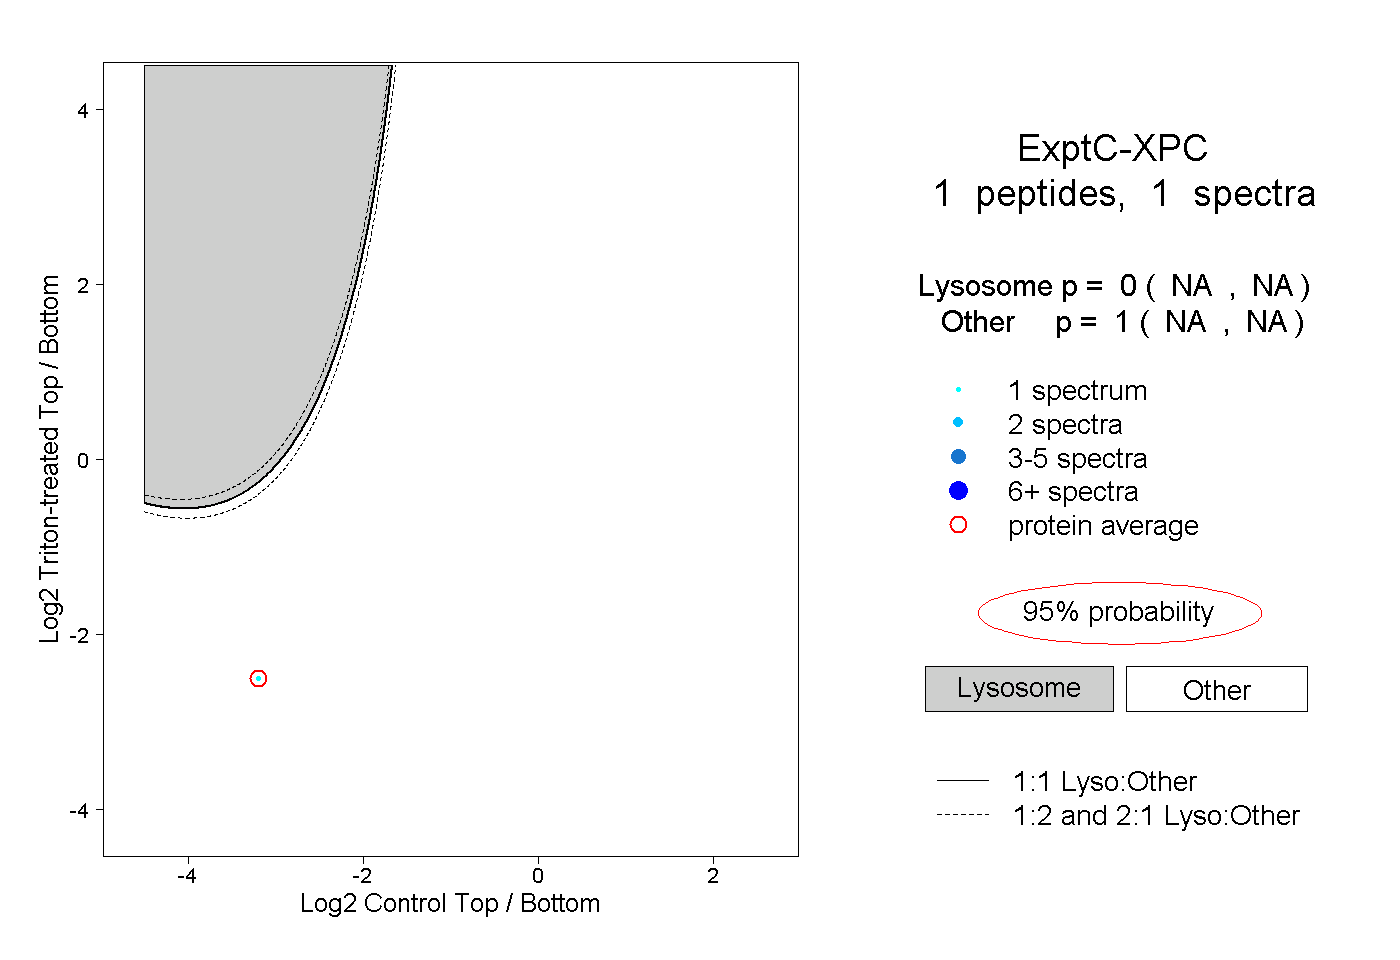
| Plot | Lyso | Other | |||||||||||
| Expt C |
1 peptide |
1 spectrum |
|
0.000 NA | NA |
1.000 NA | NA |
| 1 spectrum, AAEASHLFPFEK | 0.000 | 1.000 |