9
9peptides
spectra
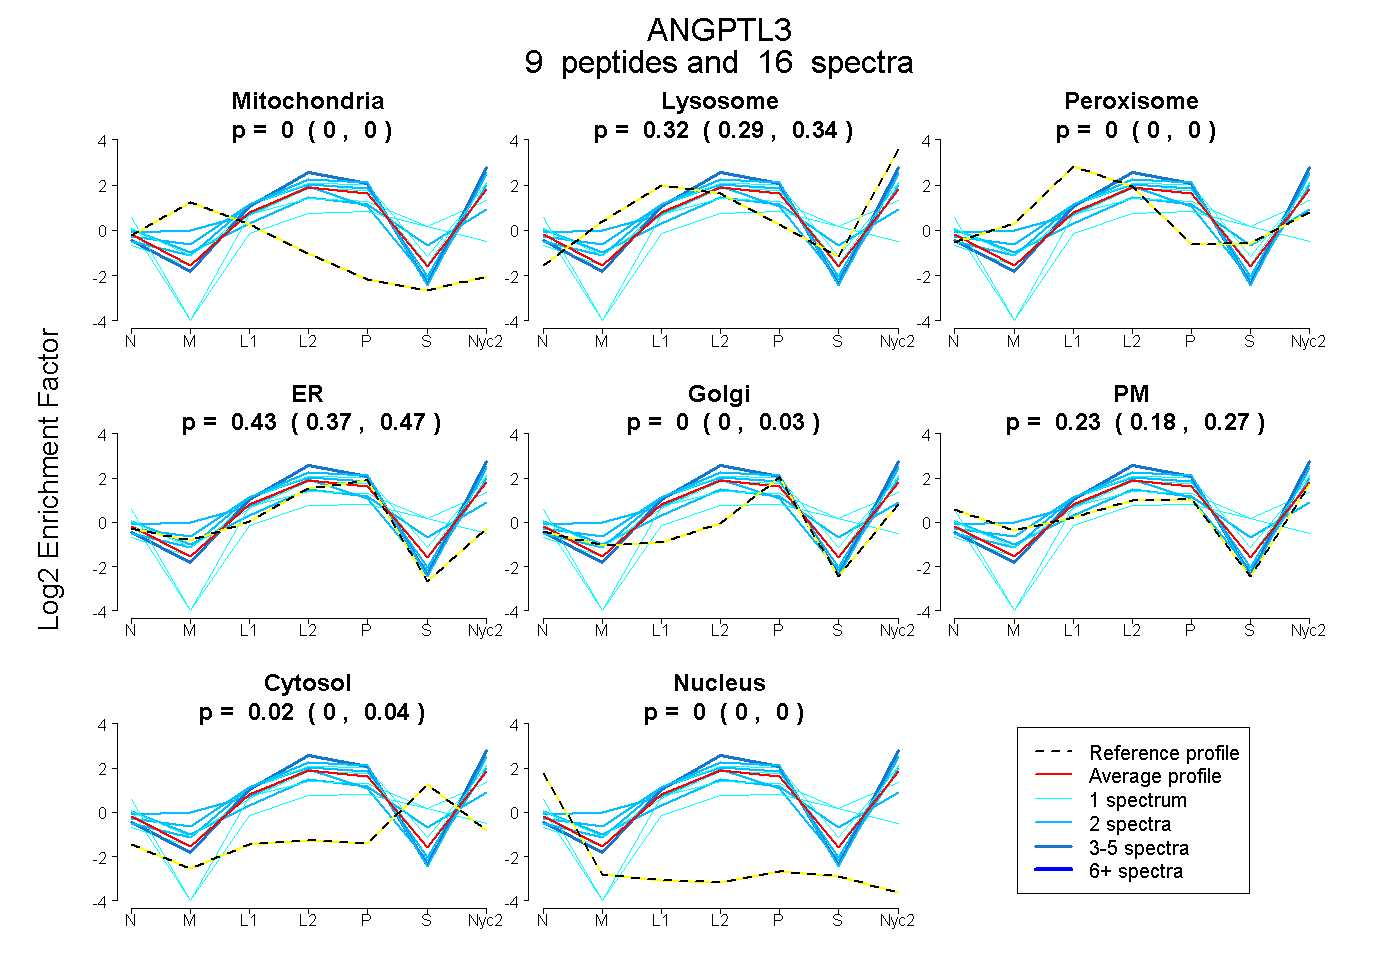
0.000 | 0.000
0.291 | 0.337
0.000 | 0.000
0.370 | 0.468
0.000 | 0.027
0.182 | 0.273
0.001 | 0.041
0.000 | 0.000
4peptides
spectra
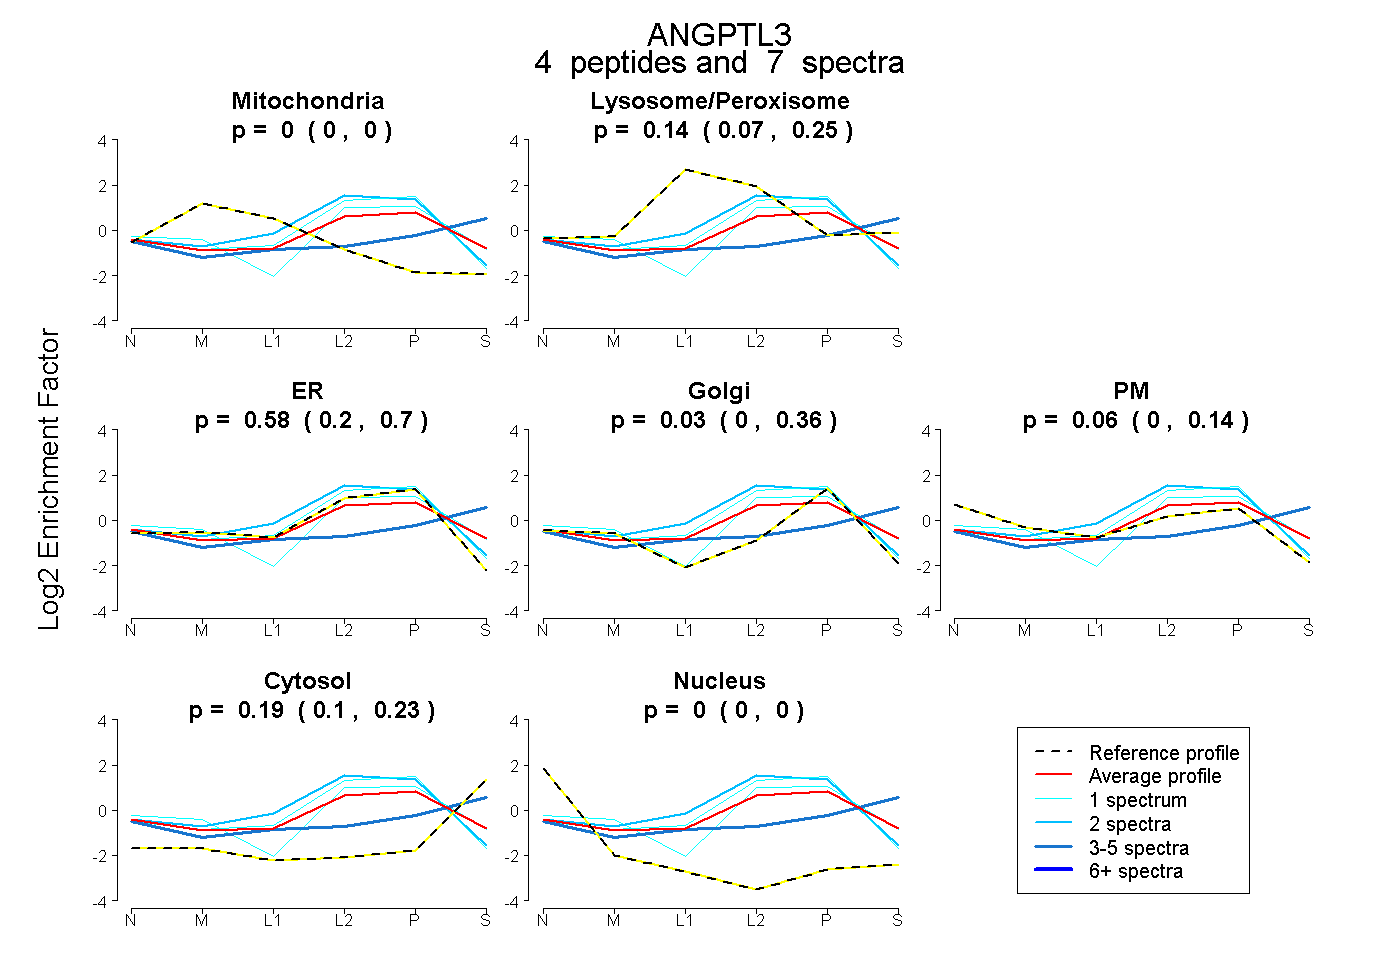
0.000 | 0.000
0.066 | 0.248
0.199 | 0.696
0.000 | 0.358
0.000 | 0.141
0.100 | 0.233
0.000 | 0.000
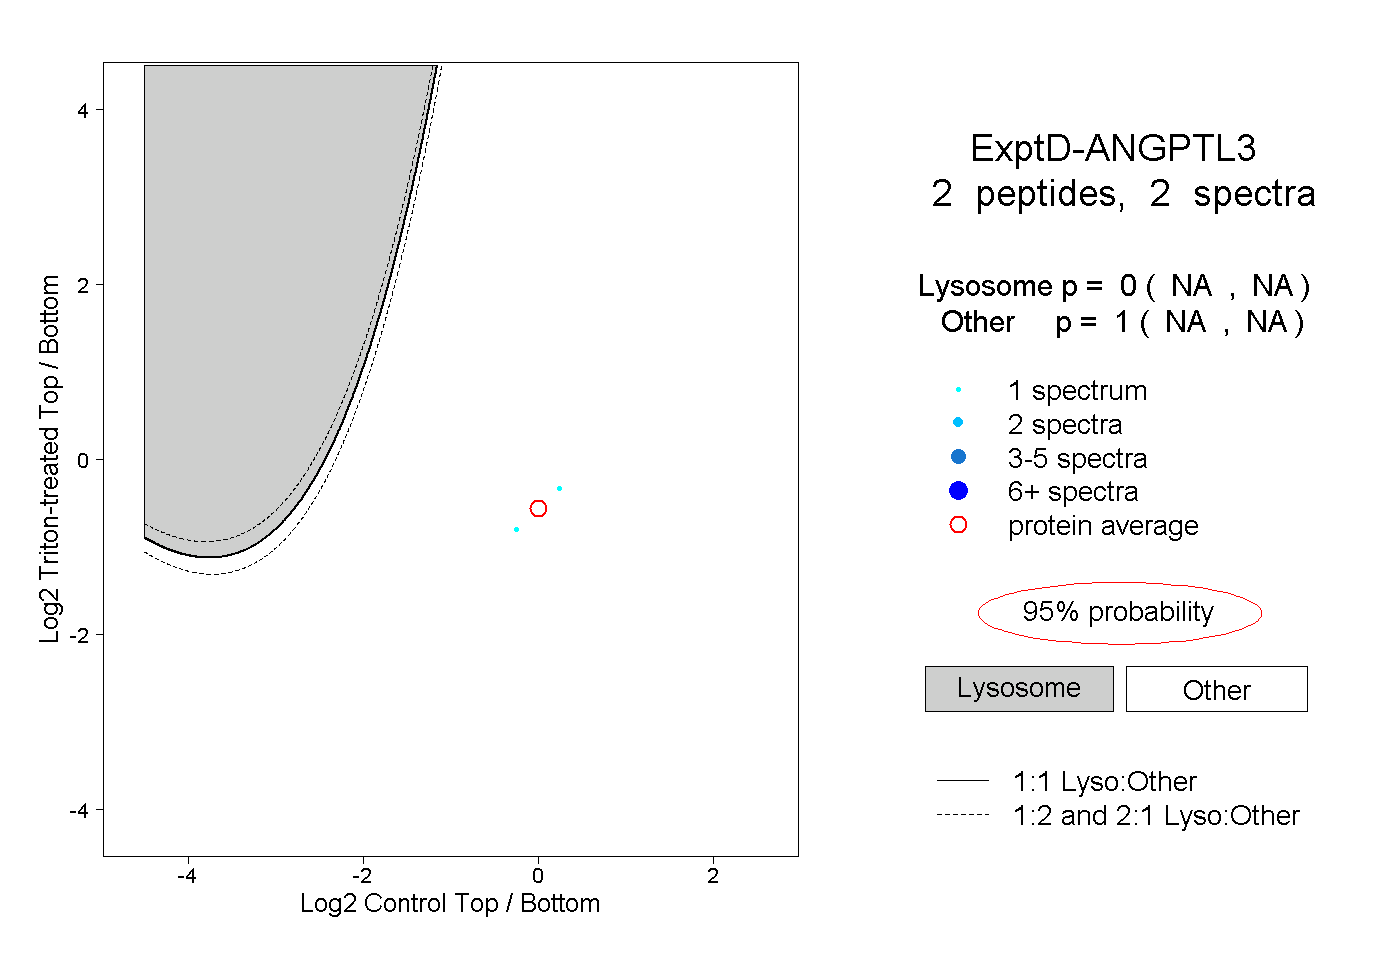
12peptides
spectra
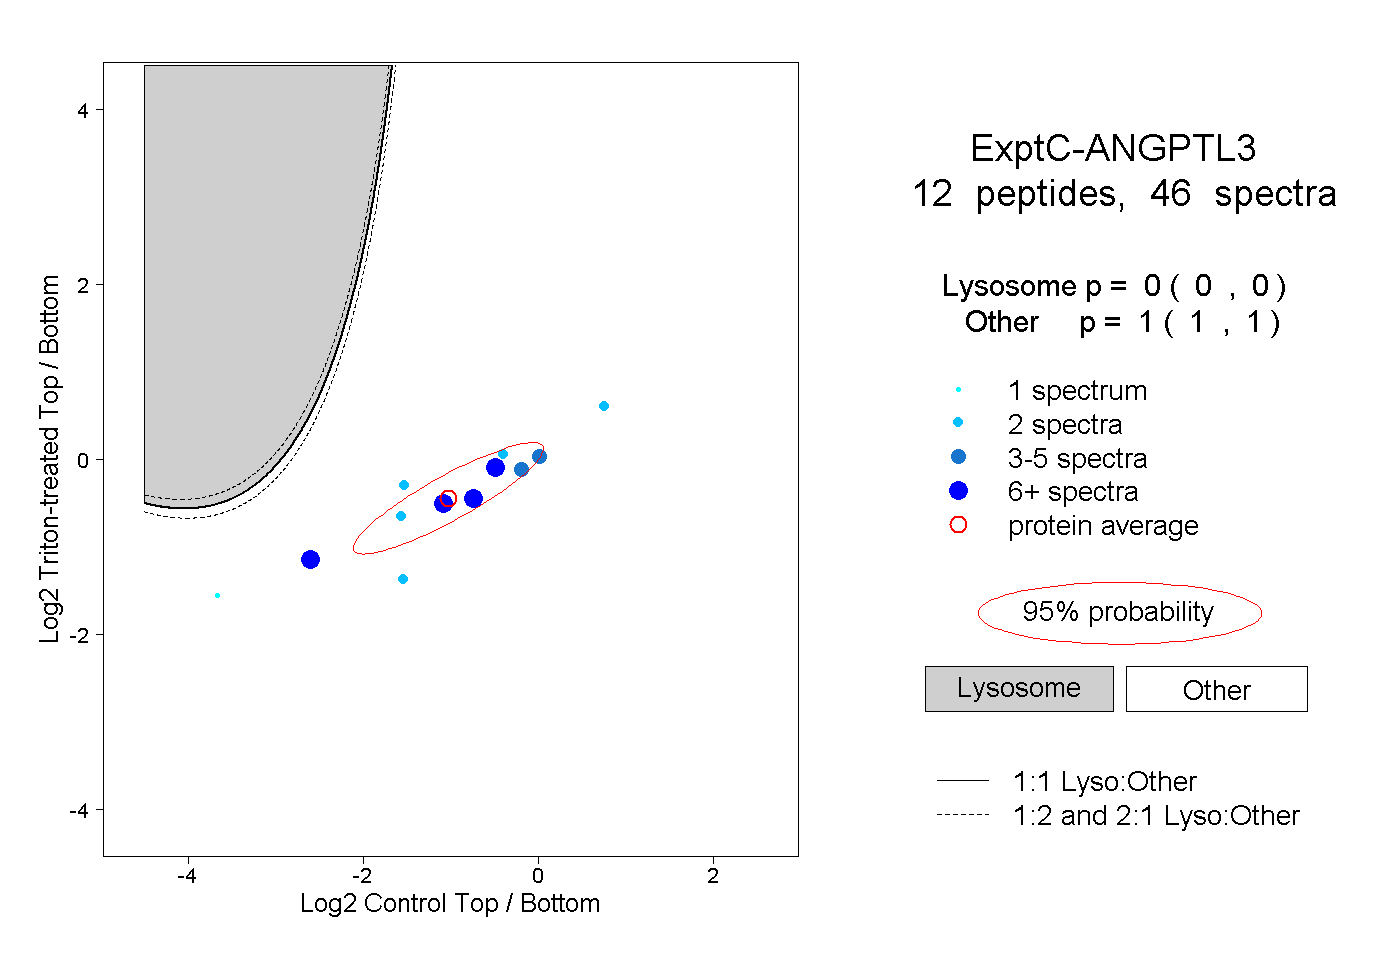
0.000 | 0.000
1.000 | 1.000