 9
9peptides
spectra
0.000 | 0.000
0.291 | 0.337
0.000 | 0.000
0.370 | 0.468
0.000 | 0.027
0.182 | 0.273
0.001 | 0.041
0.000 | 0.000
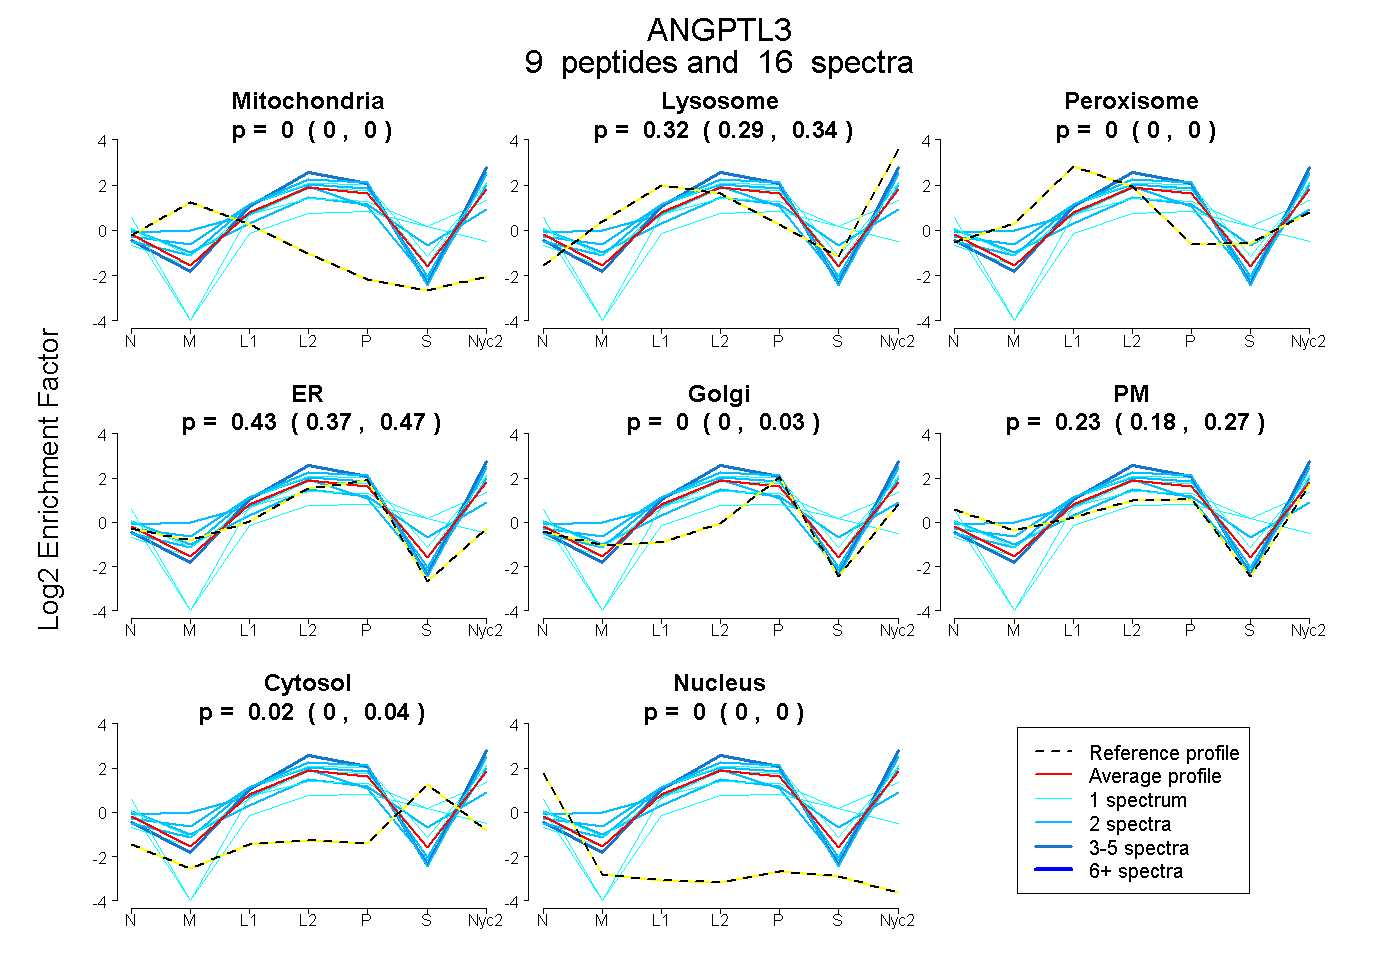
| Plot | Mito | Lyso | Perox | ER | Golgi | PM | Cytosol | Nucleus | |||||
| Expt A |
9 peptides |
16 spectra |
|
0.000 0.000 | 0.000 |
0.315 0.291 | 0.337 |
0.000 0.000 | 0.000 |
0.427 0.370 | 0.468 |
0.000 0.000 | 0.027 |
0.235 0.182 | 0.273 |
0.023 0.001 | 0.041 |
0.000 0.000 | 0.000 |
| 4 spectra, LESLLEEK | 0.000 | 0.417 | 0.000 | 0.380 | 0.000 | 0.202 | 0.000 | 0.000 | ||
| 1 spectrum, EHPEVTSLK | 0.000 | 0.196 | 0.000 | 0.291 | 0.000 | 0.137 | 0.376 | 0.000 | ||
| 2 spectra, EIENQLR | 0.000 | 0.431 | 0.000 | 0.257 | 0.000 | 0.312 | 0.000 | 0.000 | ||
| 2 spectra, SFVEQQDNSIR | 0.000 | 0.417 | 0.000 | 0.418 | 0.000 | 0.164 | 0.000 | 0.000 | ||
| 1 spectrum, TGIQEPTENSLYSKPR | 0.000 | 0.287 | 0.000 | 0.280 | 0.003 | 0.429 | 0.000 | 0.000 | ||
| 2 spectra, GQINDIFQK | 0.000 | 0.331 | 0.000 | 0.221 | 0.000 | 0.449 | 0.000 | 0.000 | ||
| 2 spectra, ALEEQLTSLVQNPPGAR | 0.000 | 0.103 | 0.135 | 0.305 | 0.000 | 0.286 | 0.171 | 0.000 | ||
| 1 spectrum, ELLQSVEEQYK | 0.000 | 0.478 | 0.000 | 0.464 | 0.059 | 0.000 | 0.000 | 0.000 | ||
| 1 spectrum, NIEQDDLPADCSAIYNR | 0.000 | 0.000 | 0.000 | 0.468 | 0.000 | 0.000 | 0.532 | 0.000 |
| Plot | Mito | Lyso or Perox | ER | Golgi | PM | Cytosol | Nucleus | ||||||
| Expt B |
4 peptides |
7 spectra |
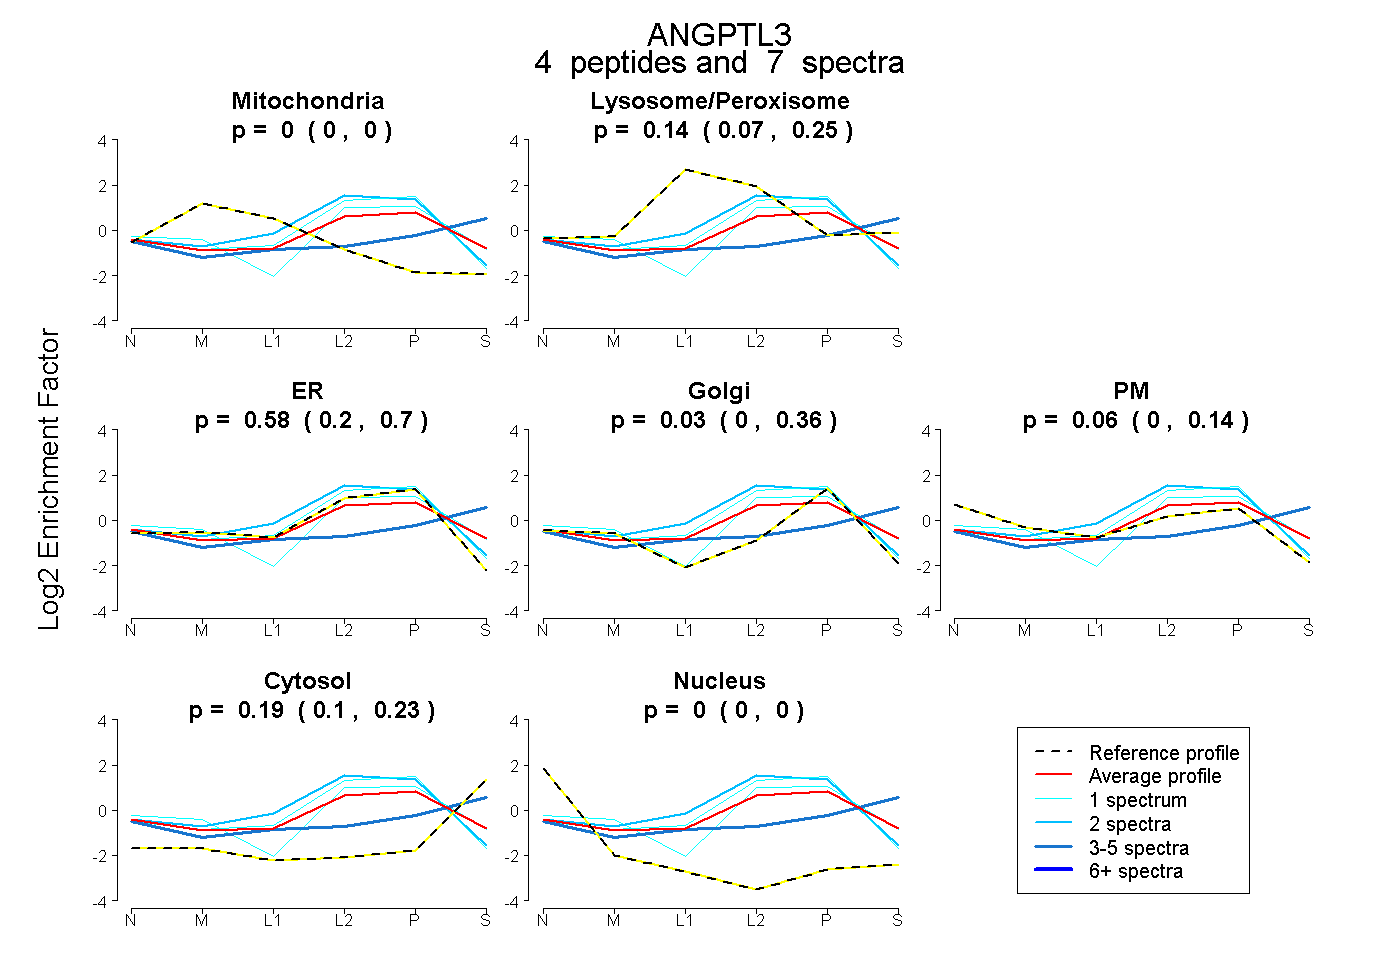 |
0.000 0.000 | 0.000 |
0.135 0.066 | 0.248 |
0.580 0.199 | 0.696 |
0.029 0.000 | 0.358 |
0.062 0.000 | 0.141 |
0.194 0.100 | 0.233 |
0.000 0.000 | 0.000 |
|||
| Plot | Lyso | Other | |||||||||||
| Expt C |
12 peptides |
46 spectra |
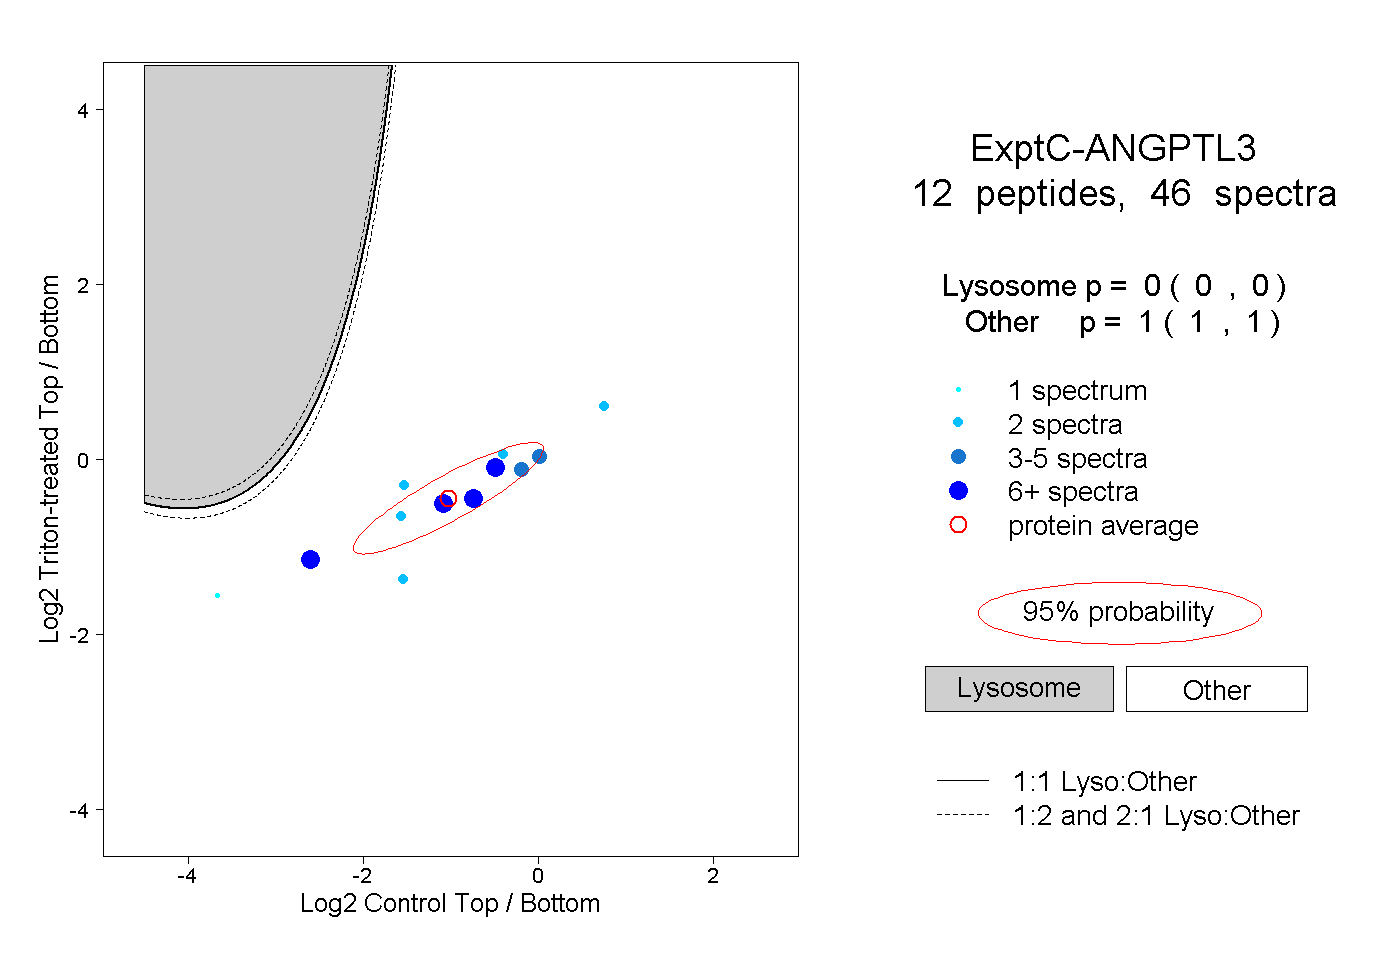 |
0.000 0.000 | 0.000 |
1.000 1.000 | 1.000 |
||||||||
| Plot | Lyso | Other | |||||||||||
| Expt D |
2 peptides |
2 spectra |
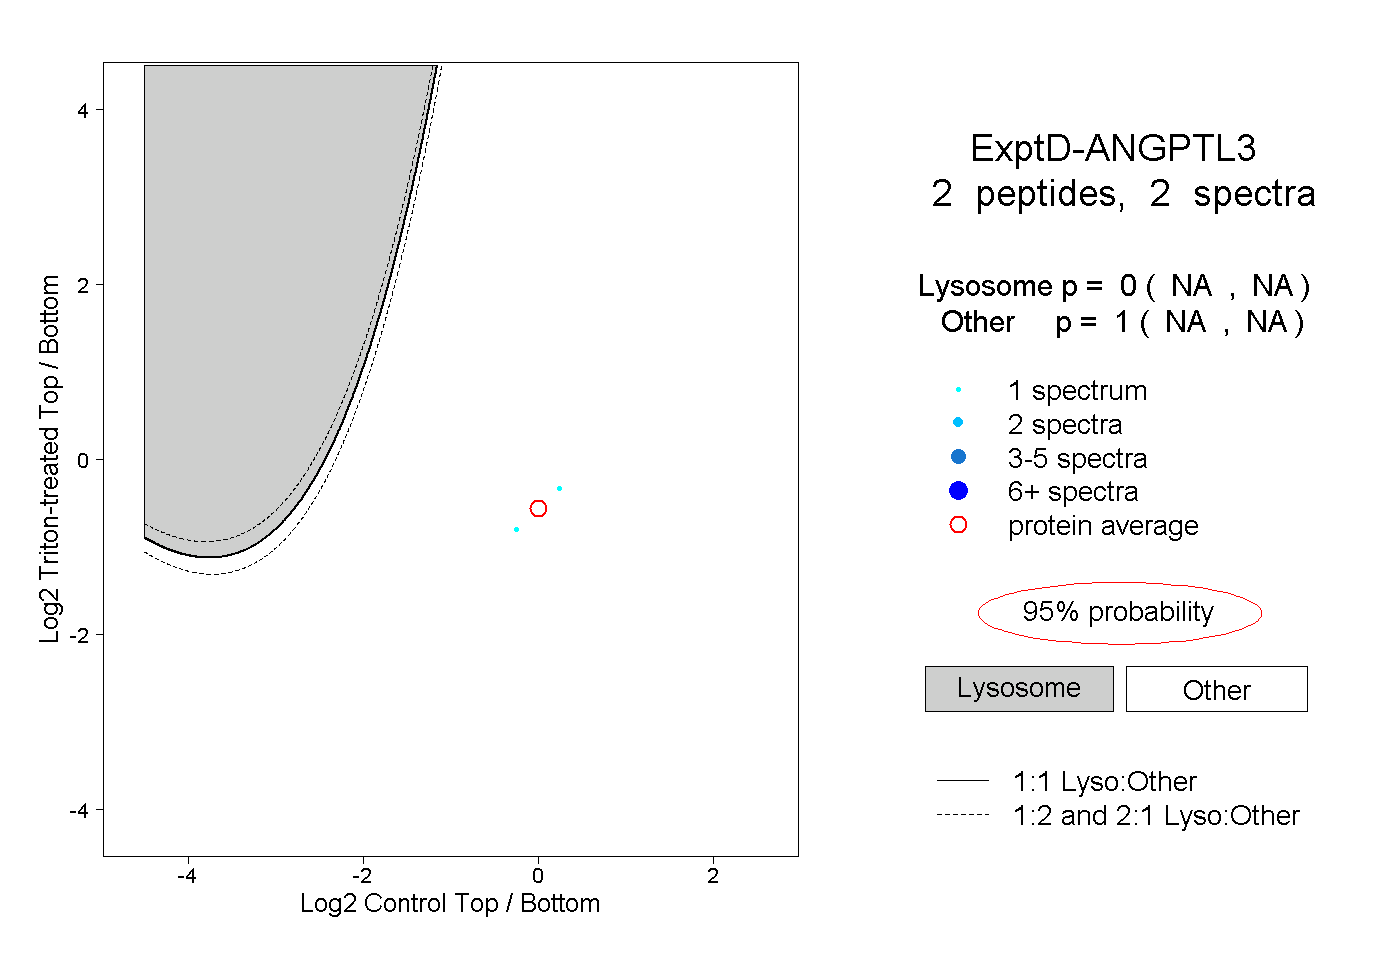 |
0.000 NA | NA |
1.000 NA | NA |