 1
1peptide
spectra
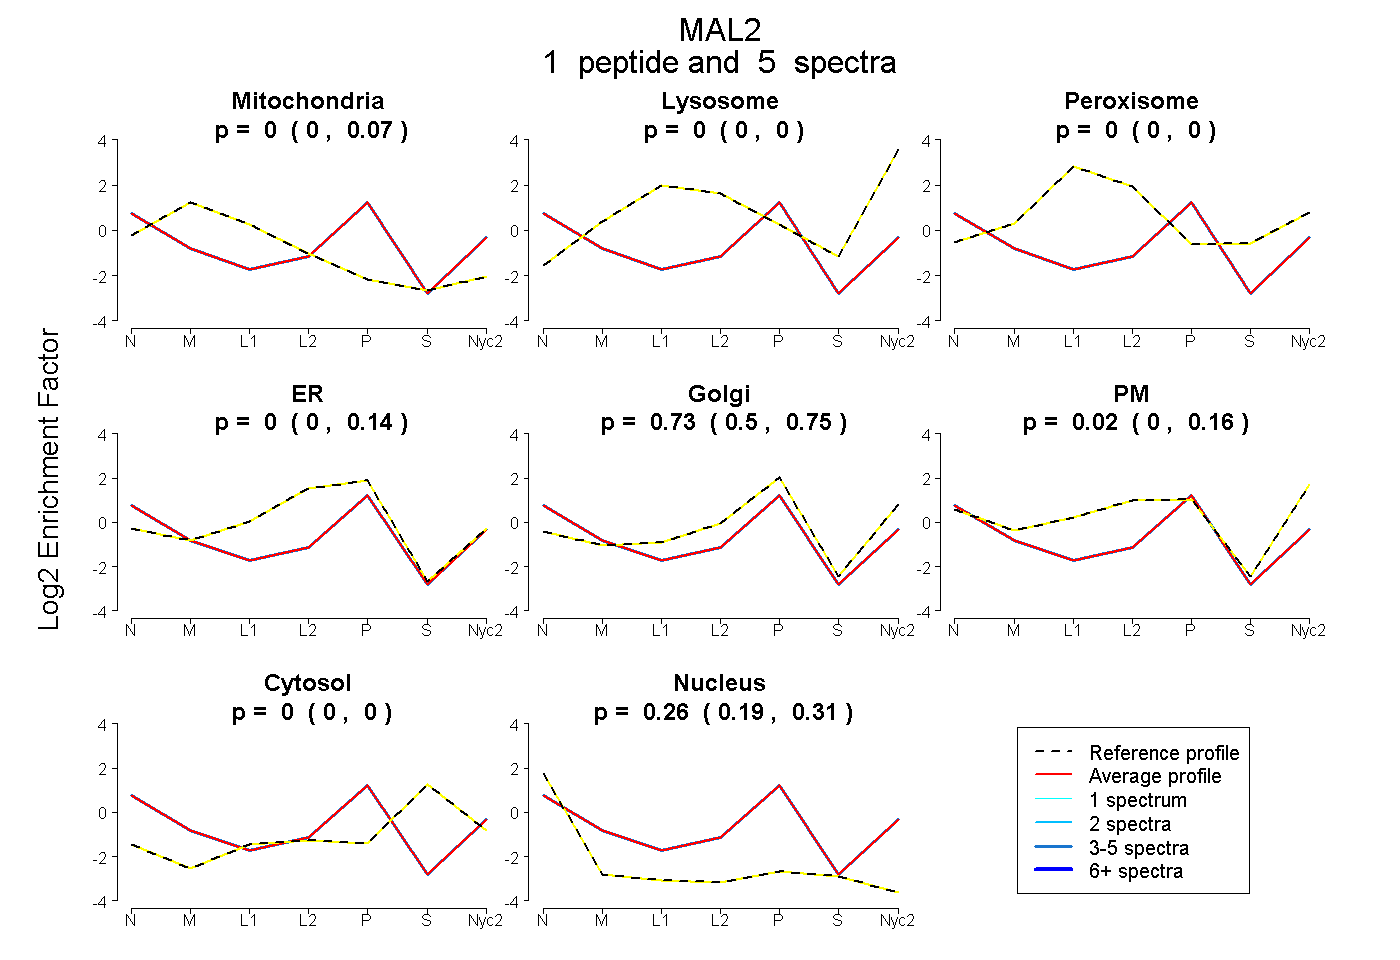
0.000 | 0.067
0.000 | 0.000
0.000 | 0.000
0.000 | 0.143
0.495 | 0.752
0.000 | 0.155
0.000 | 0.000
0.190 | 0.310
1peptide
spectra
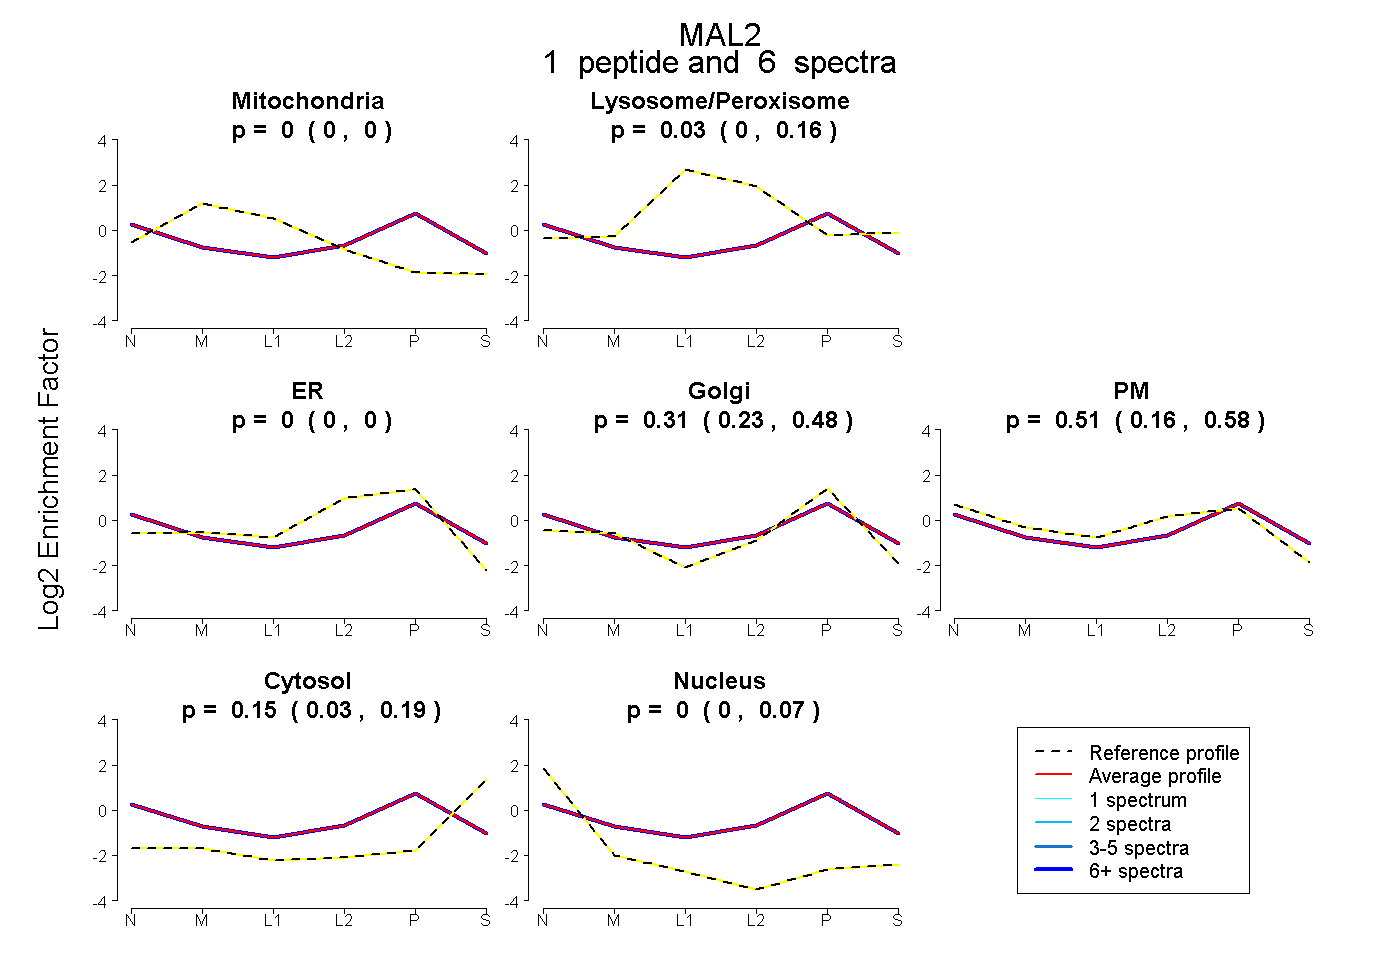
0.000 | 0.000
0.000 | 0.155
0.000 | 0.000
0.227 | 0.484
0.163 | 0.575
0.029 | 0.194
0.000 | 0.075
1peptide
spectra
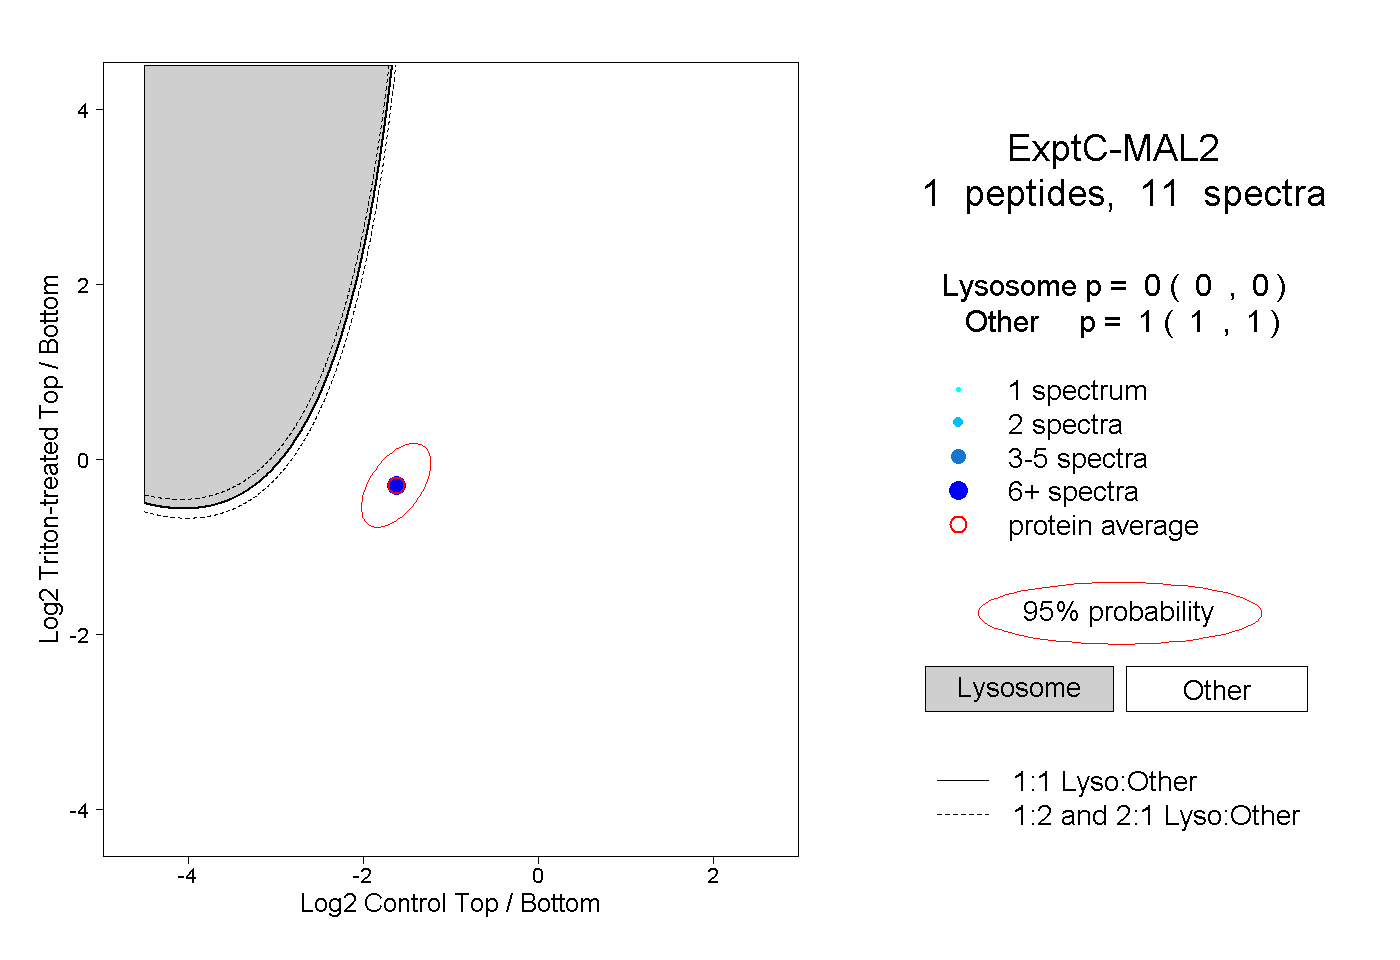
0.000 | 0.000
1.000 | 1.000