 4
4peptides
spectra
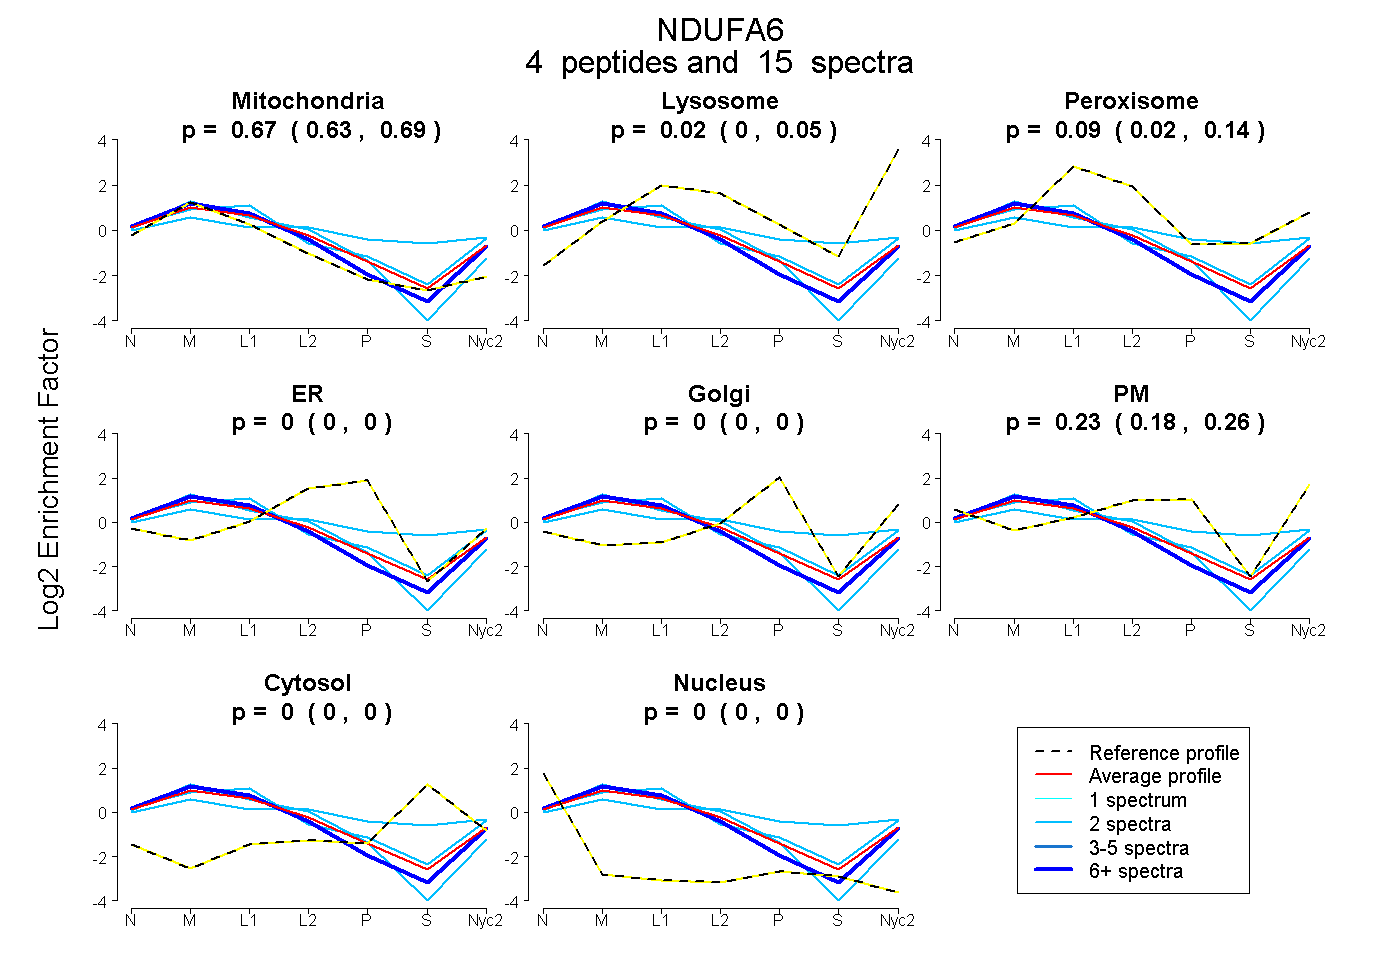
0.634 | 0.692
0.000 | 0.050
0.022 | 0.138
0.000 | 0.000
0.000 | 0.000
0.180 | 0.263
0.000 | 0.000
0.000 | 0.000
3peptides
spectra
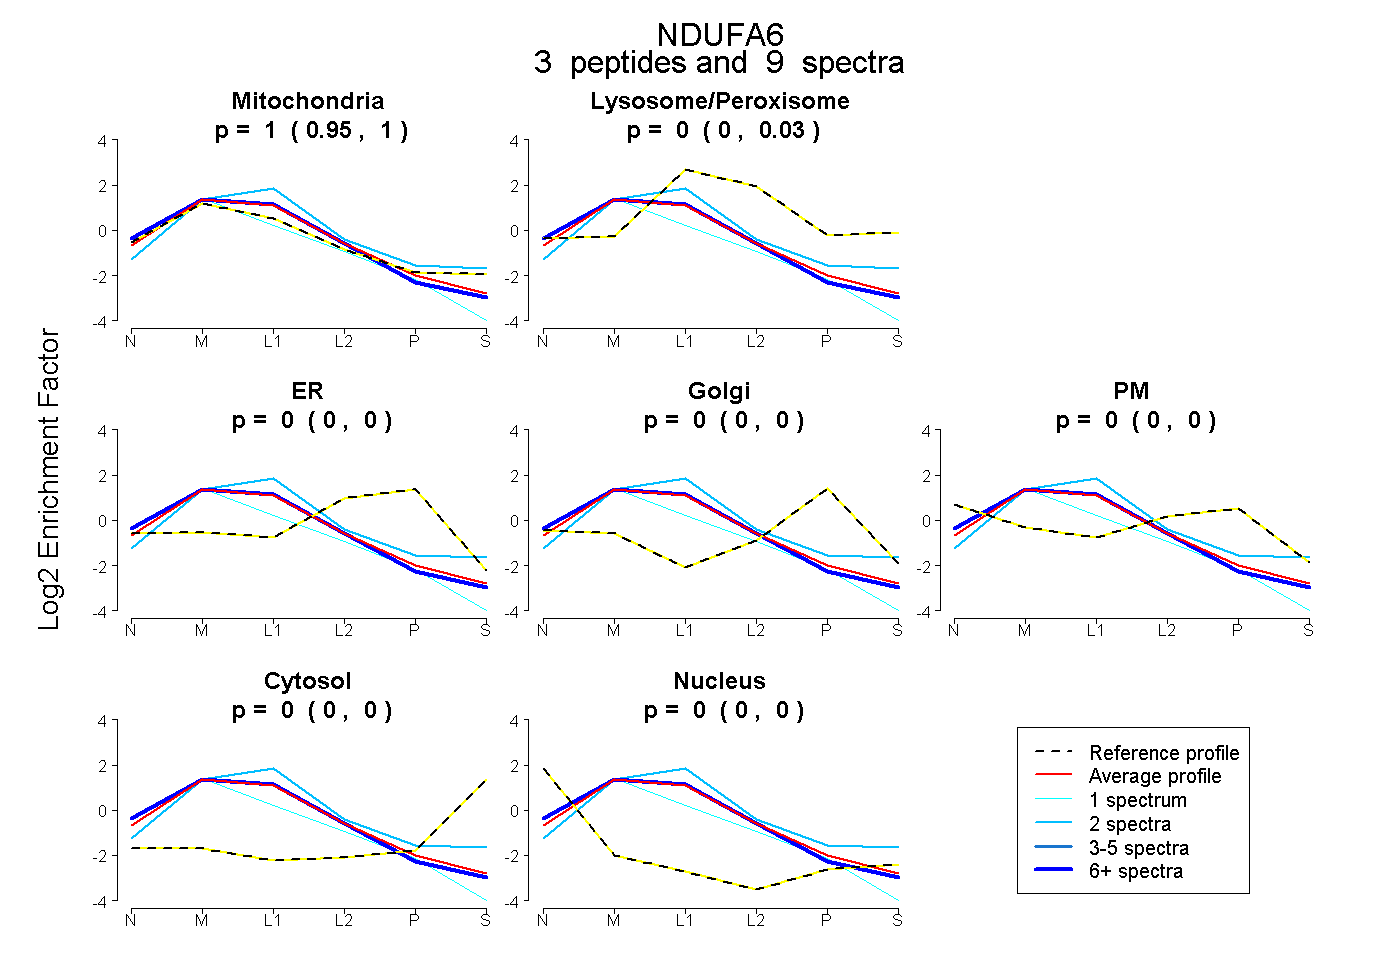
0.955 | 1.000
0.000 | 0.031
0.000 | 0.000
0.000 | 0.000
0.000 | 0.000
0.000 | 0.000
0.000 | 0.000
6peptides
spectra
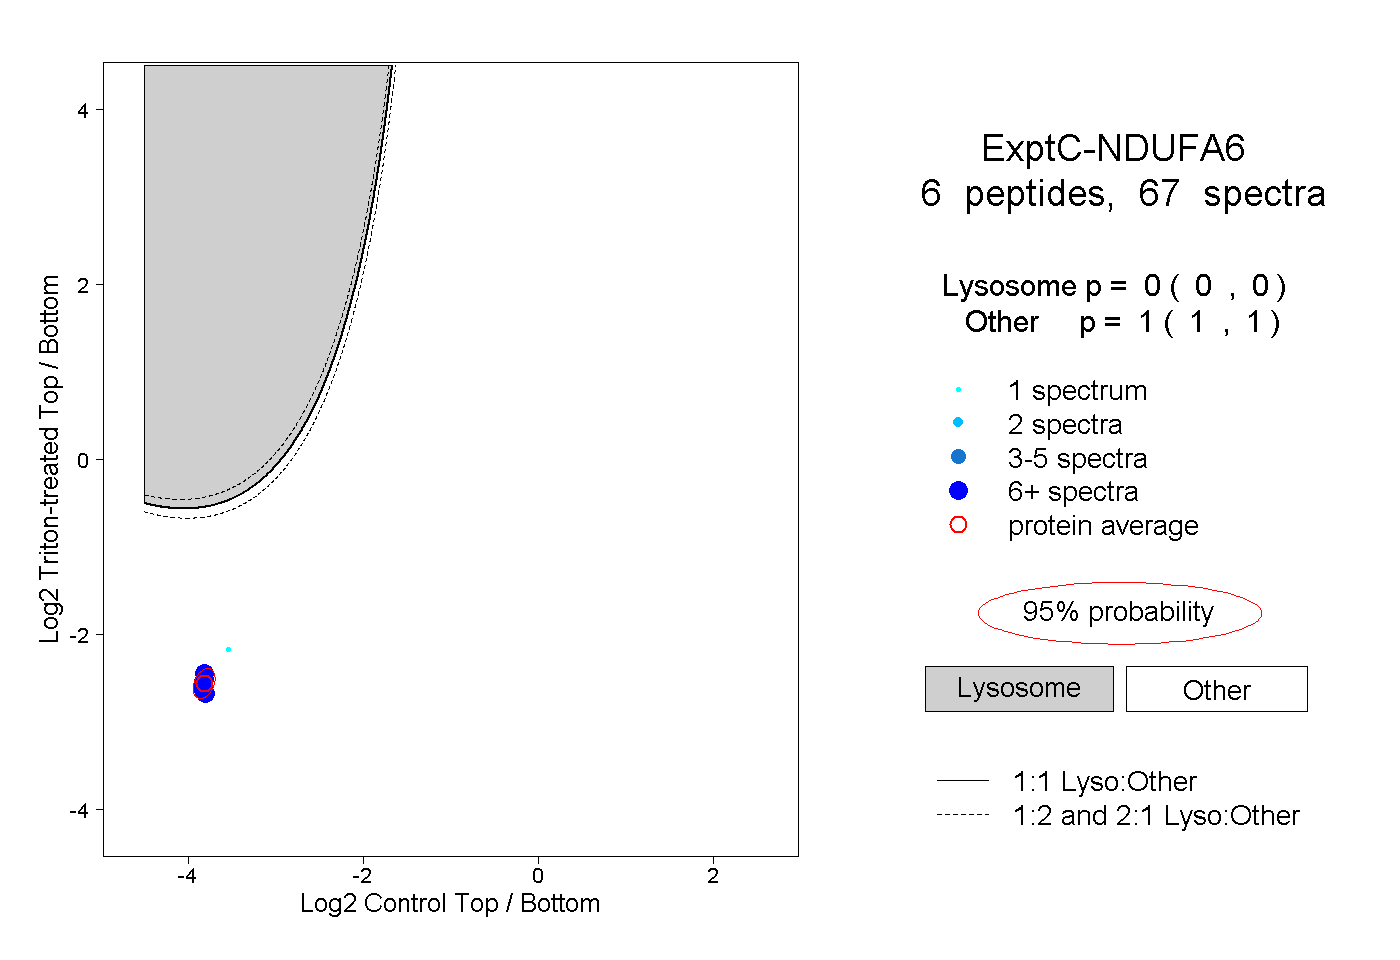
0.000 | 0.000
1.000 | 1.000
1peptide
spectrum
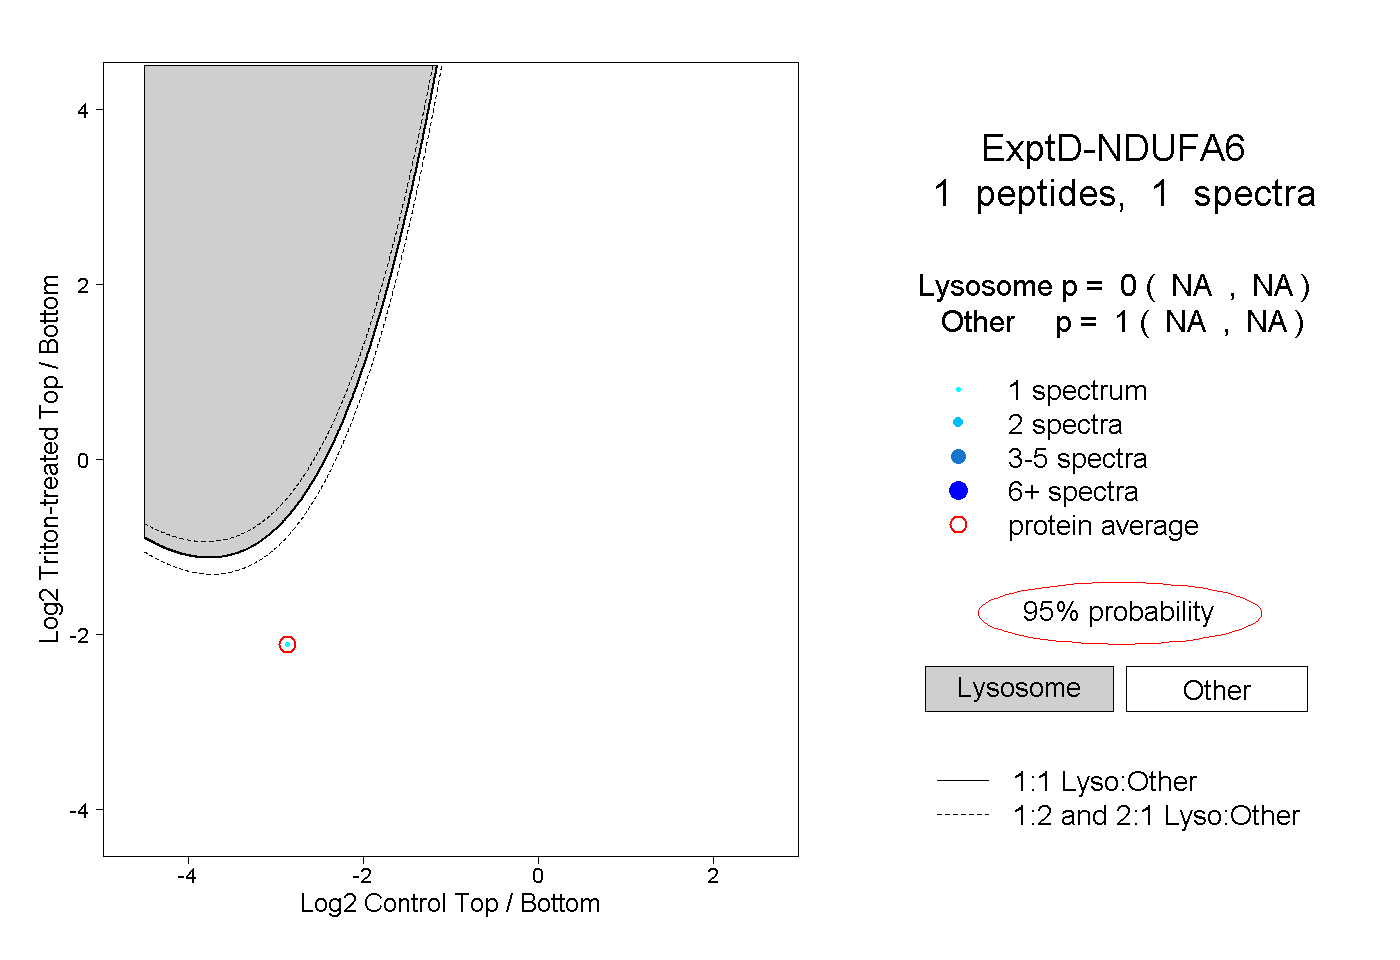
NA | NA
NA | NA