SNX11
[ENSRNOP00000011474]
Main page
| | | Plot |
Mito |
Lyso |
|
Perox |
ER |
Golgi |
PM |
Cytosol |
Nucleus |
|
| Expt A |
 2
2
peptides |
5
spectra |
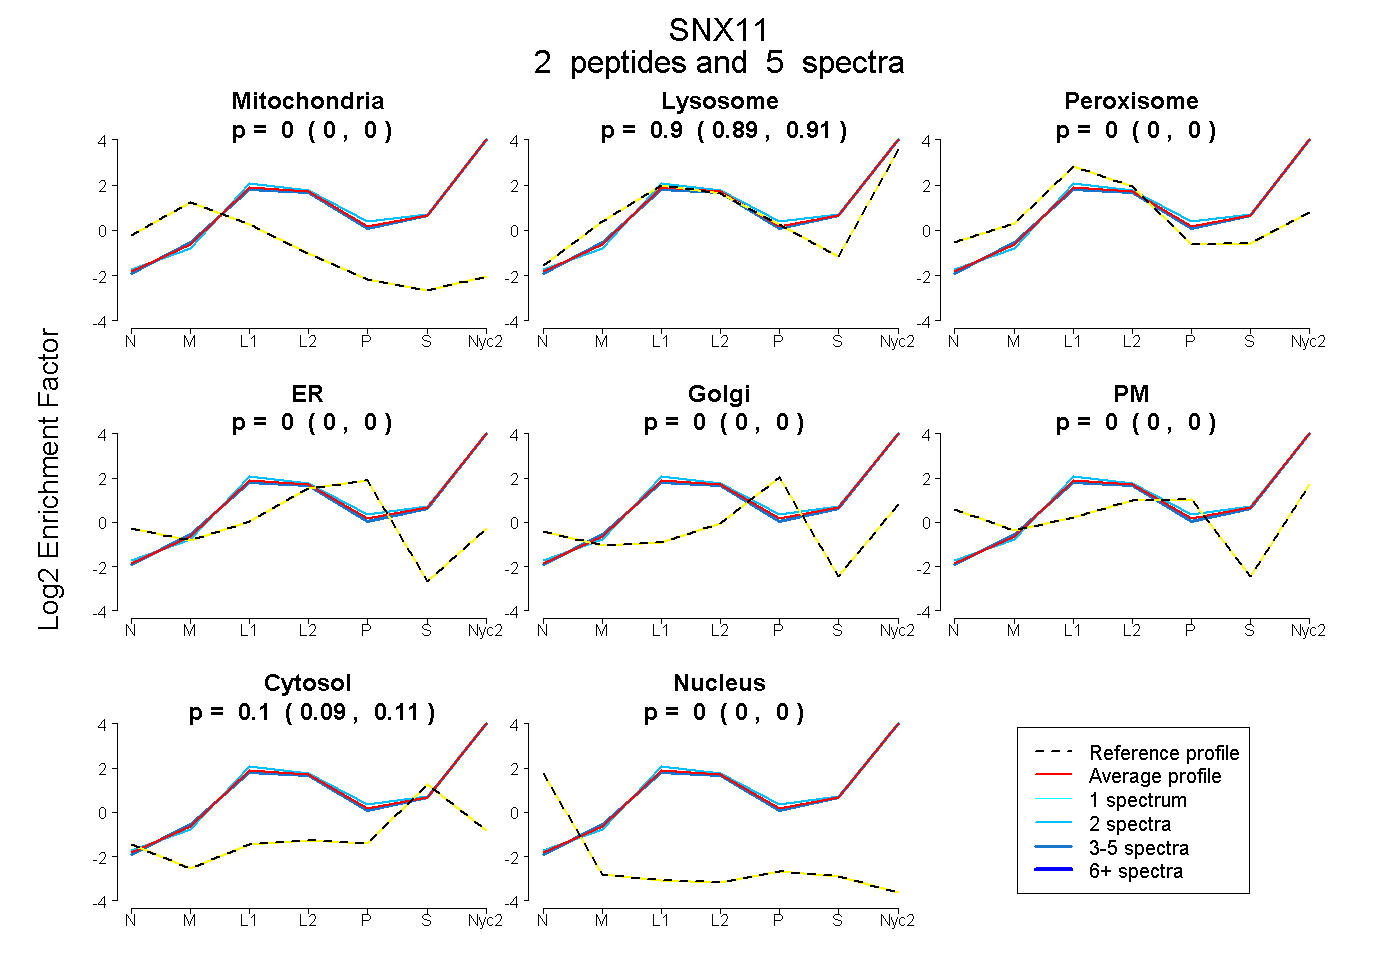 |
0.000
0.000 | 0.000 |
0.900
0.888 | 0.910 |
|
0.000
0.000 | 0.000 |
0.000
0.000 | 0.000 |
0.000
0.000 | 0.000 |
0.000
0.000 | 0.000 |
0.100
0.088 | 0.110 |
0.000
0.000 | 0.000 |
|
| | | Plot |
Mito |
|
Lyso or Perox |
|
ER |
Golgi |
PM |
Cytosol |
Nucleus |
|
| Expt B |
1
peptide |
1
spectrum |
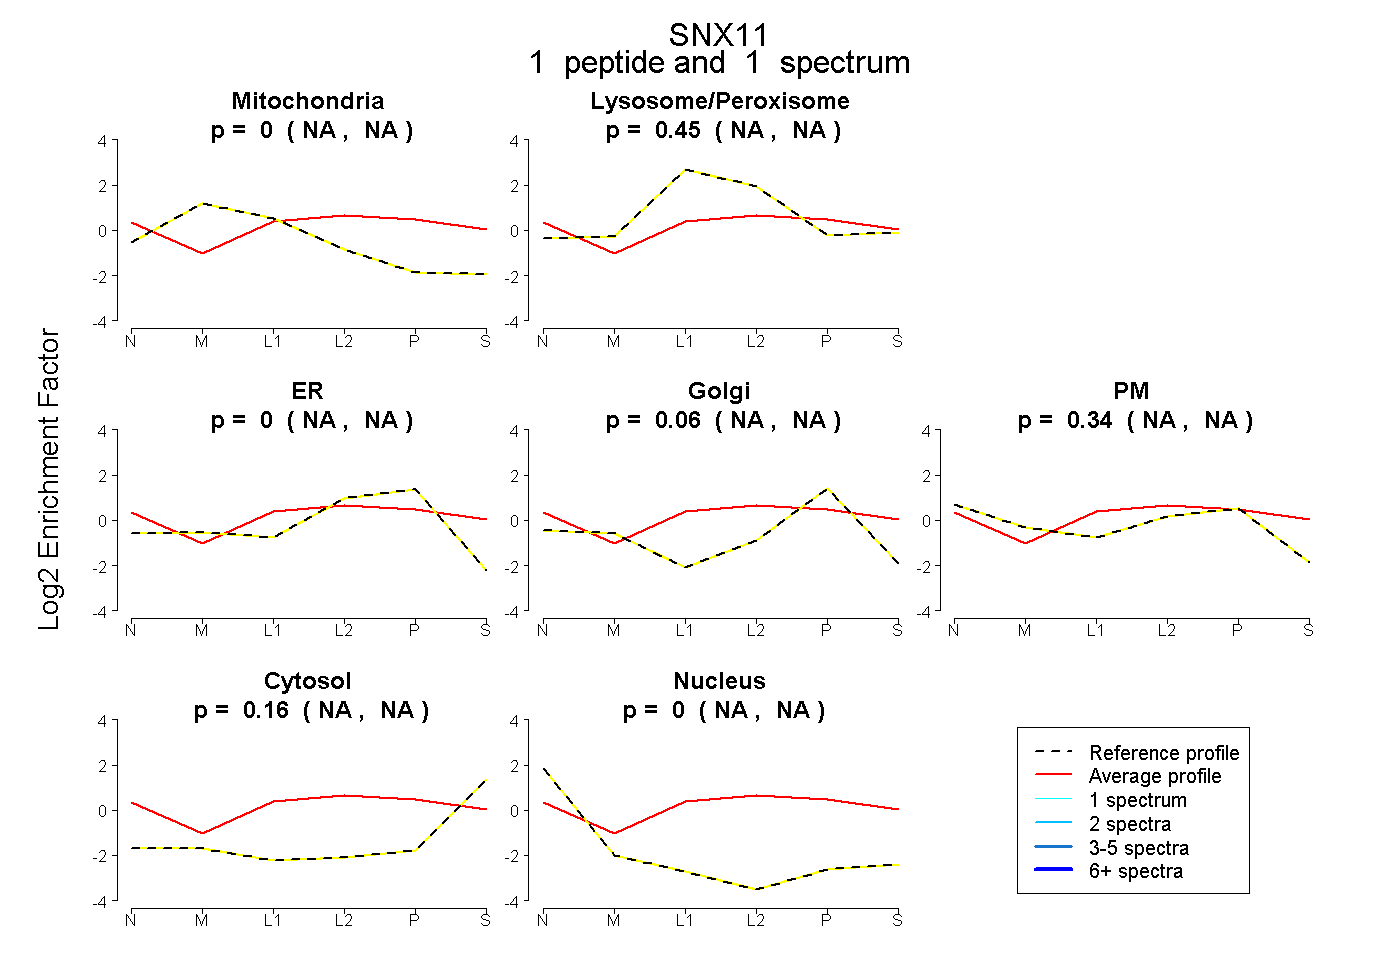 |
0.000
NA | NA |
|
0.445
NA | NA |
|
0.000
NA | NA |
0.060
NA | NA |
0.337
NA | NA |
0.157
NA | NA |
0.000
NA | NA |
|
| | | Plot |
|
Lyso |
|
|
|
|
|
|
|
Other |
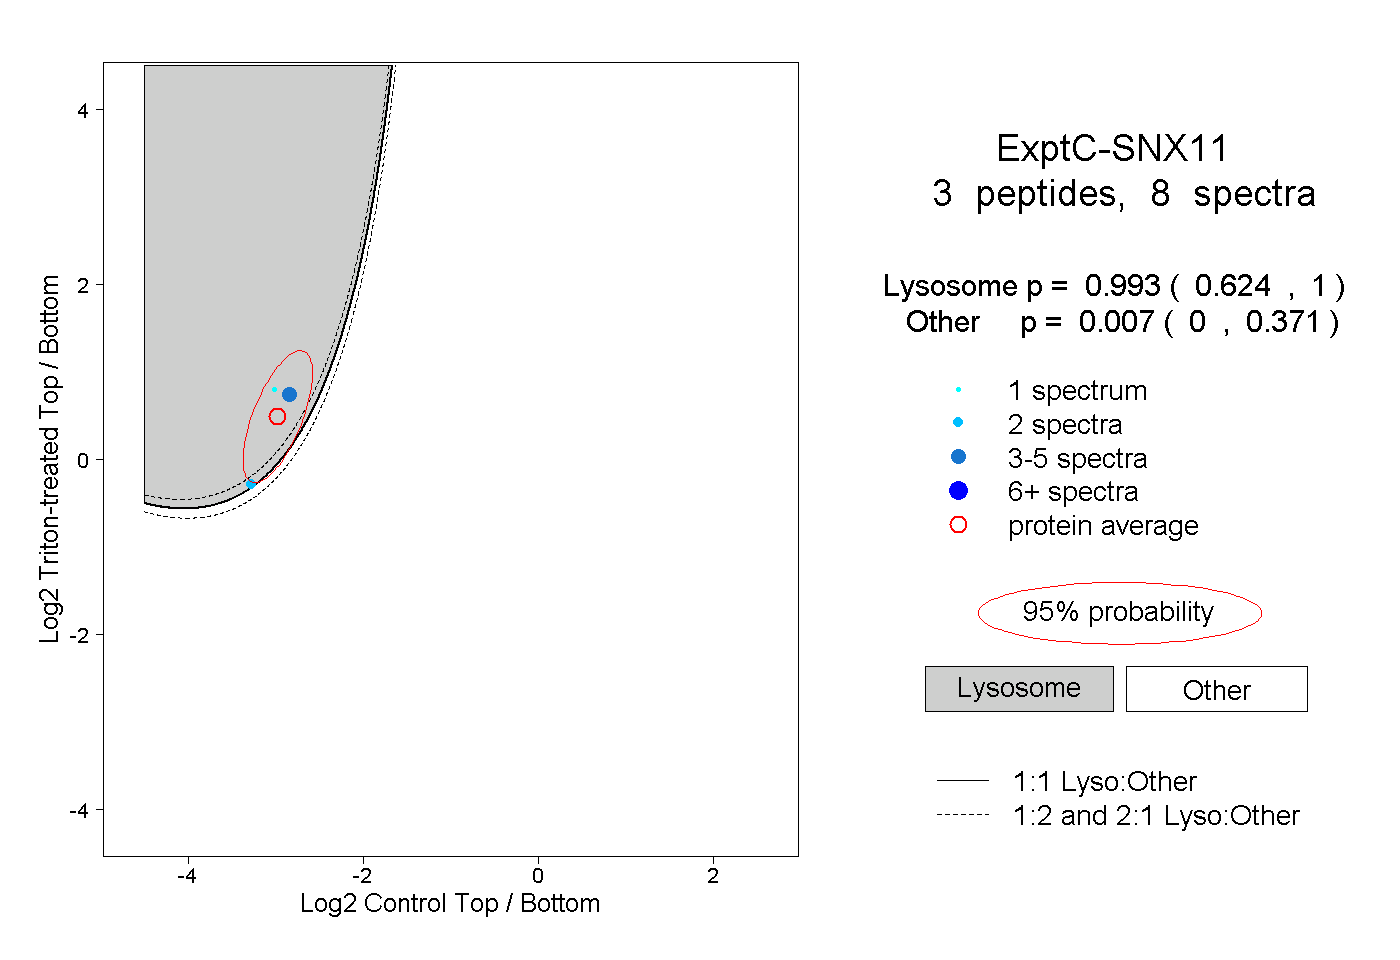
| Expt C |
3
peptides |
8
spectra |
 |
|
0.993
0.624 | 1.000 |
|
|
|
|
|
|
|
0.007
0.000 | 0.371 |
| 5 spectra, QGLQHFLEK |
|
0.996 |
|
|
|
|
|
|
|
0.004 |
| 2 spectra, QSTSHLAK |
|
0.570 |
|
|
|
|
|
|
|
0.430 |
| 1 spectrum, GDQLNSCCFLPR |
|
1.000 |
|
|
|
|
|
|
|
0.000 |
| | | Plot |
|
Lyso |
|
|
|
|
|
|
|
Other |
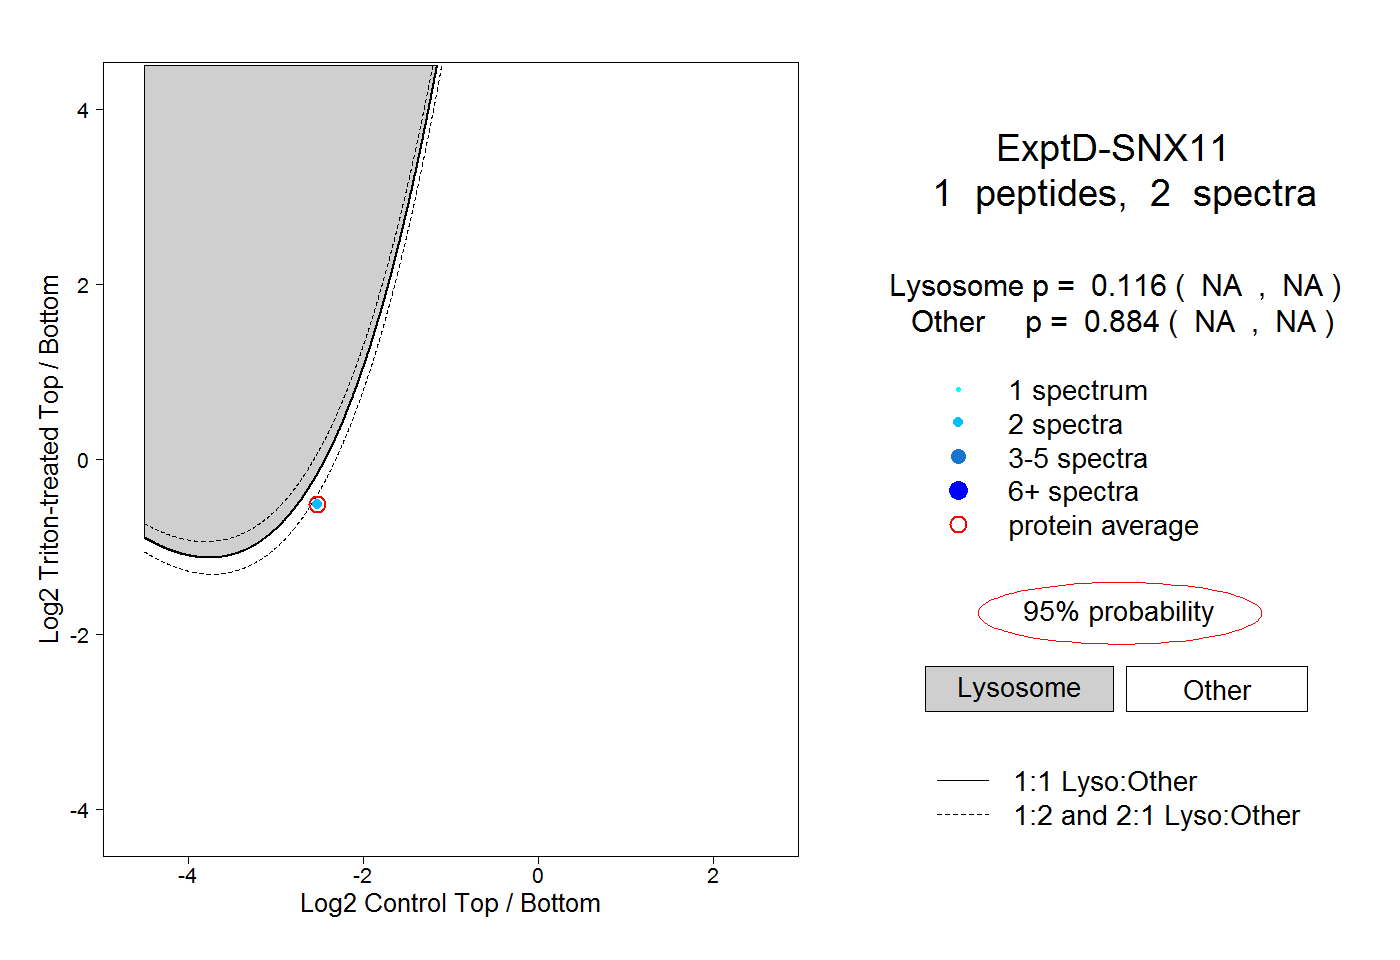
| Expt D |
1
peptide |
2
spectra |
 |
|
0.116
NA | NA |
|
|
|
|
|
|
|
0.884
NA | NA |