 2
2peptides
spectra
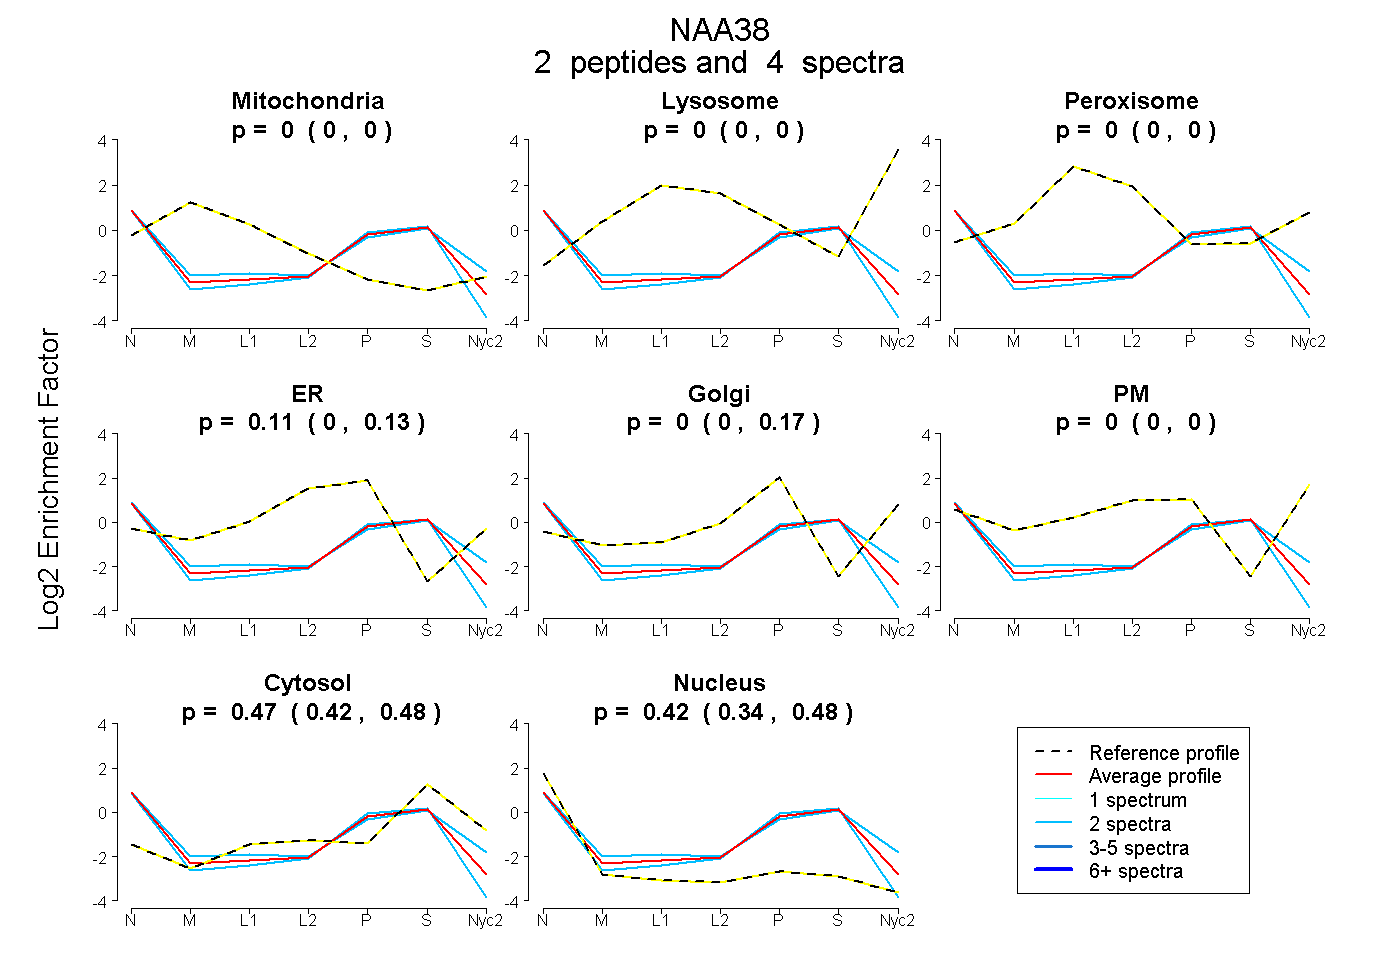
0.000 | 0.000
0.000 | 0.000
0.000 | 0.000
0.000 | 0.126
0.000 | 0.174
0.000 | 0.000
0.422 | 0.483
0.336 | 0.477
2peptides
spectra
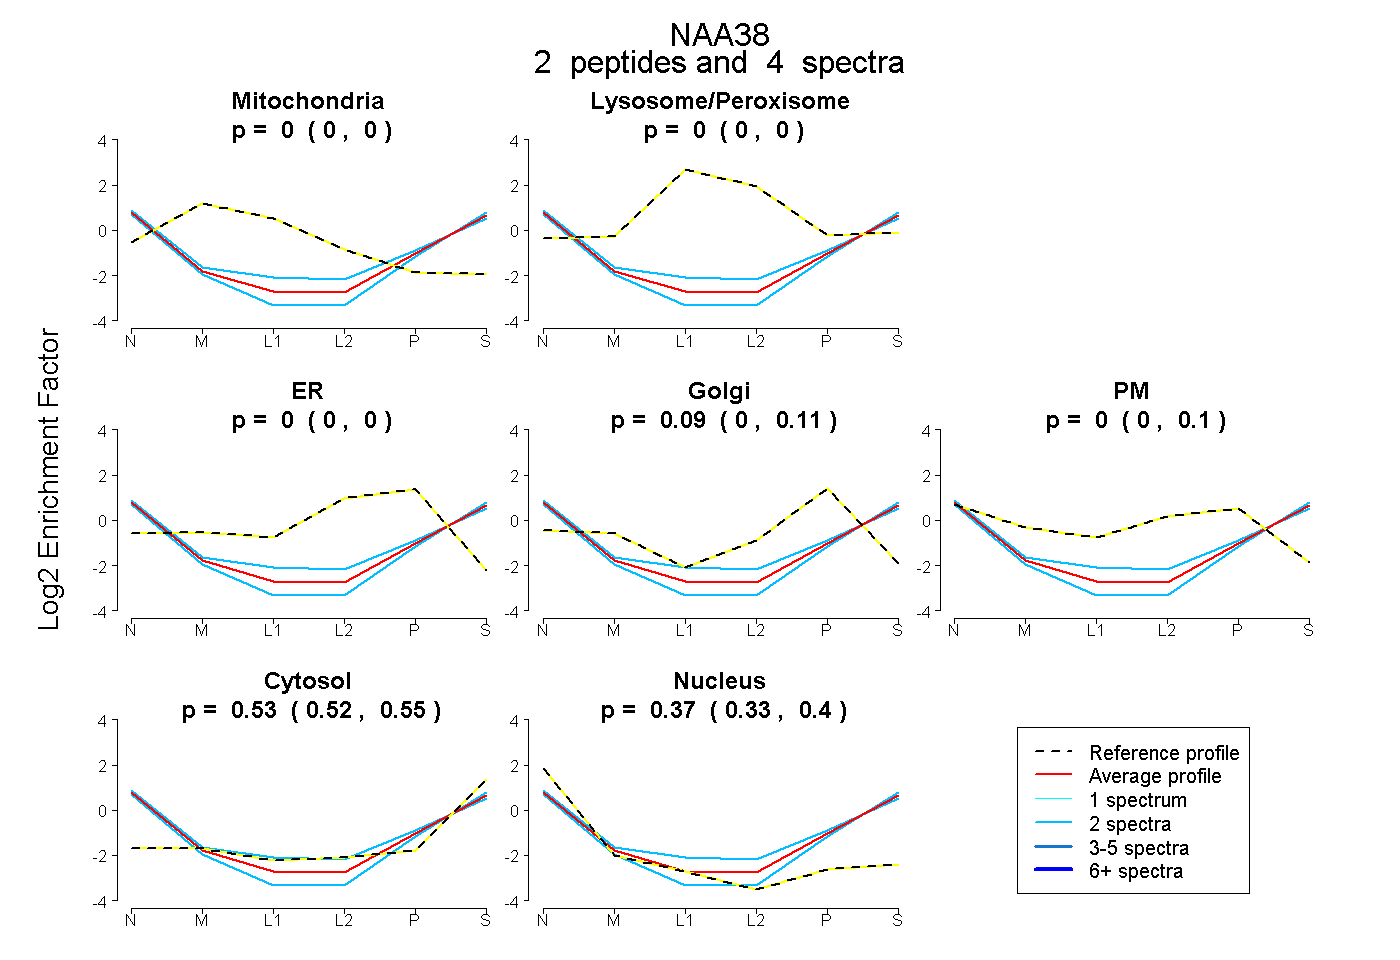
0.000 | 0.000
0.000 | 0.000
0.000 | 0.000
0.000 | 0.110
0.000 | 0.103
0.517 | 0.551
0.329 | 0.401