 3
3peptides
spectra
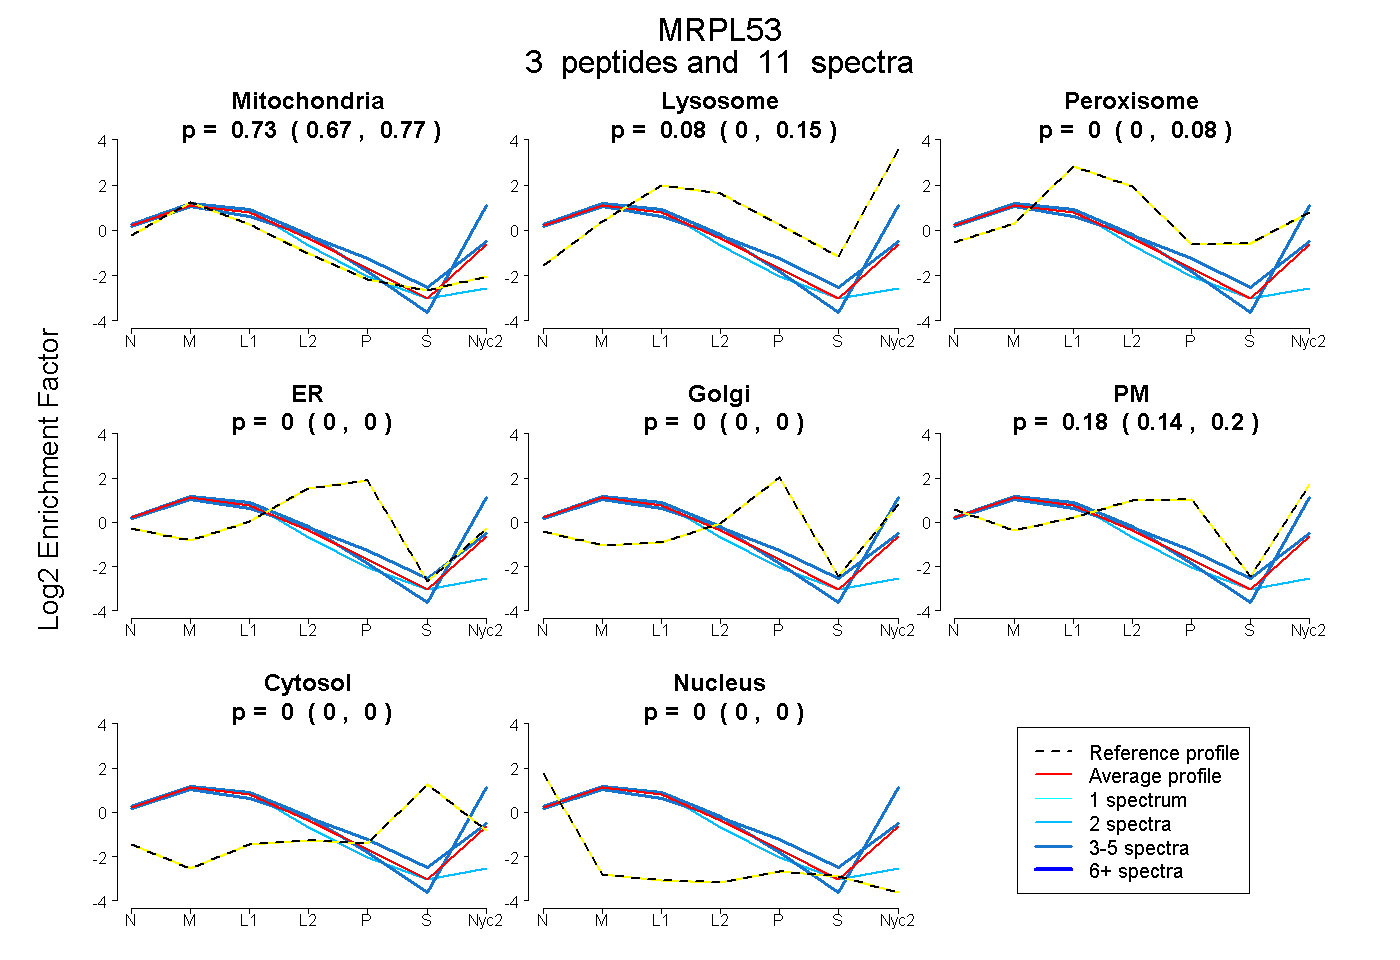
0.668 | 0.770
0.000 | 0.149
0.000 | 0.079
0.000 | 0.000
0.000 | 0.000
0.141 | 0.205
0.000 | 0.000
0.000 | 0.000
2peptides
spectra
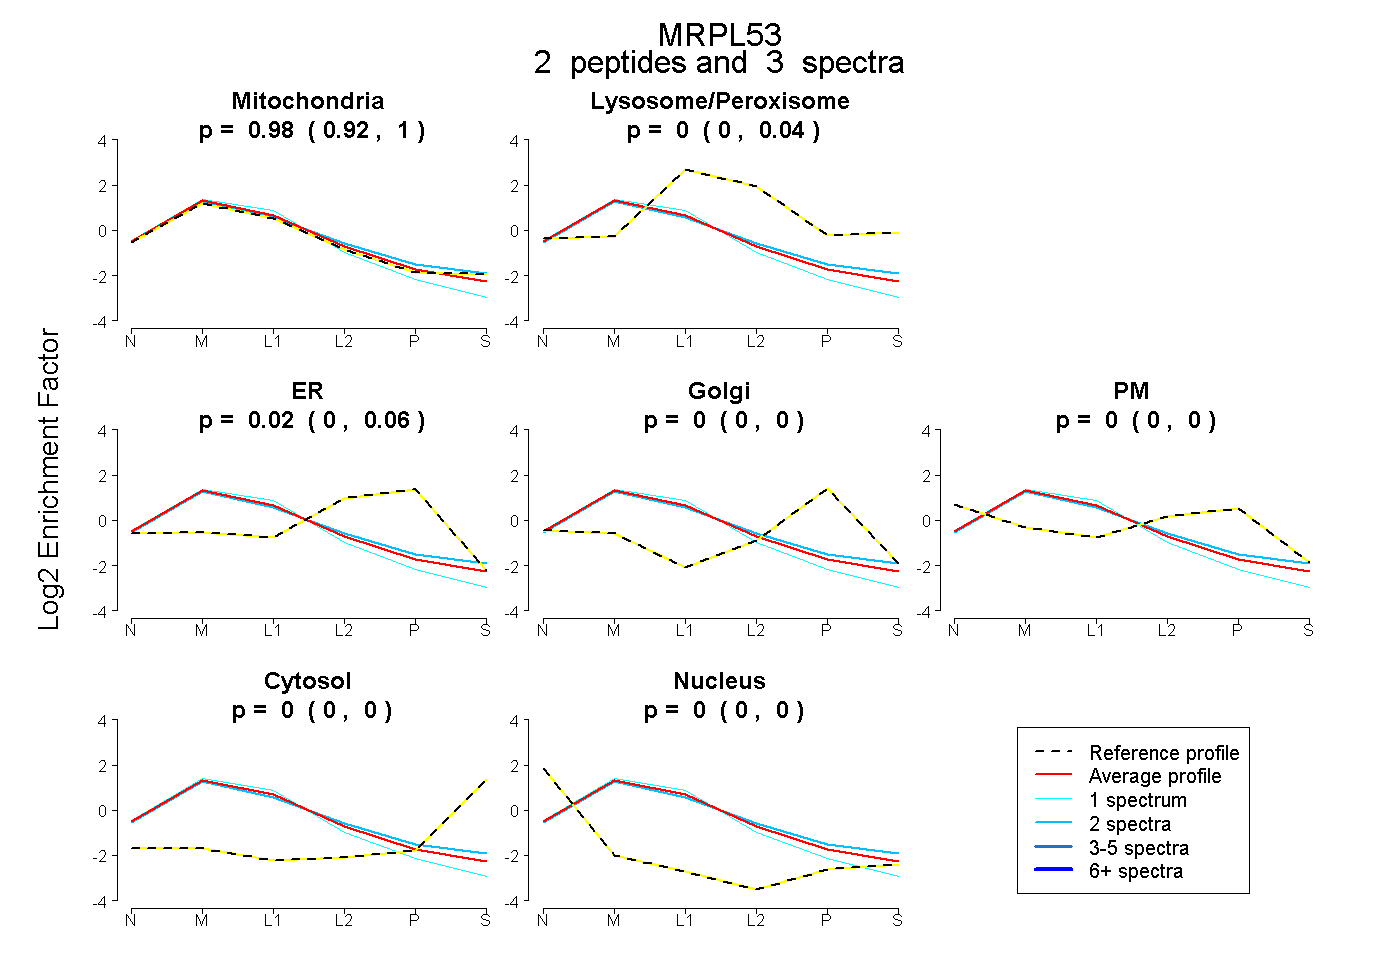
0.922 | 1.000
0.000 | 0.038
0.000 | 0.057
0.000 | 0.000
0.000 | 0.000
0.000 | 0.000
0.000 | 0.000
5peptides
spectra
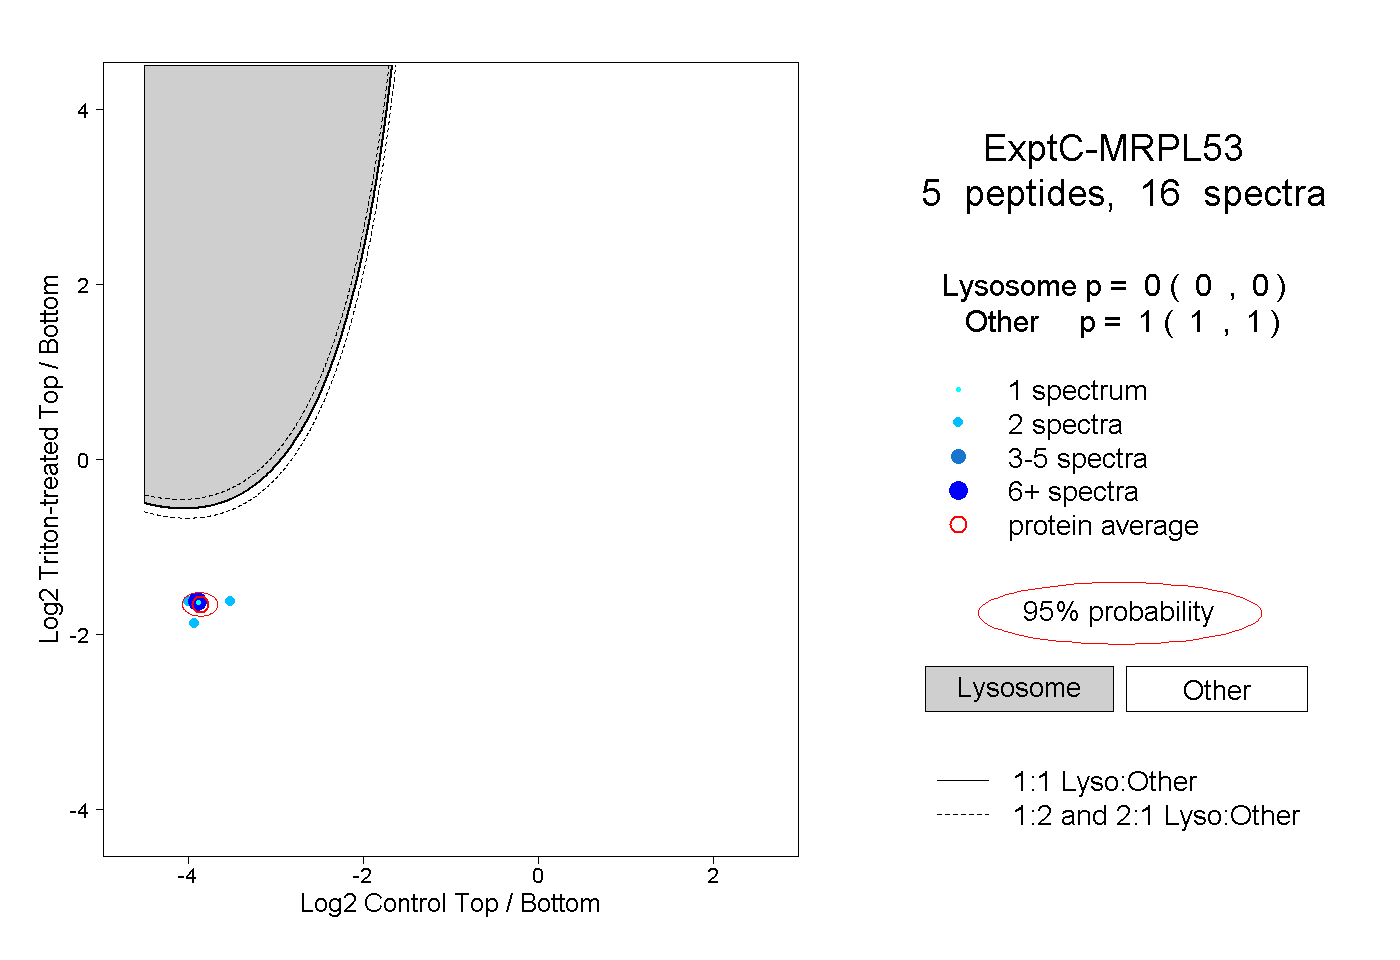
0.000 | 0.000
1.000 | 1.000
2peptides
spectra
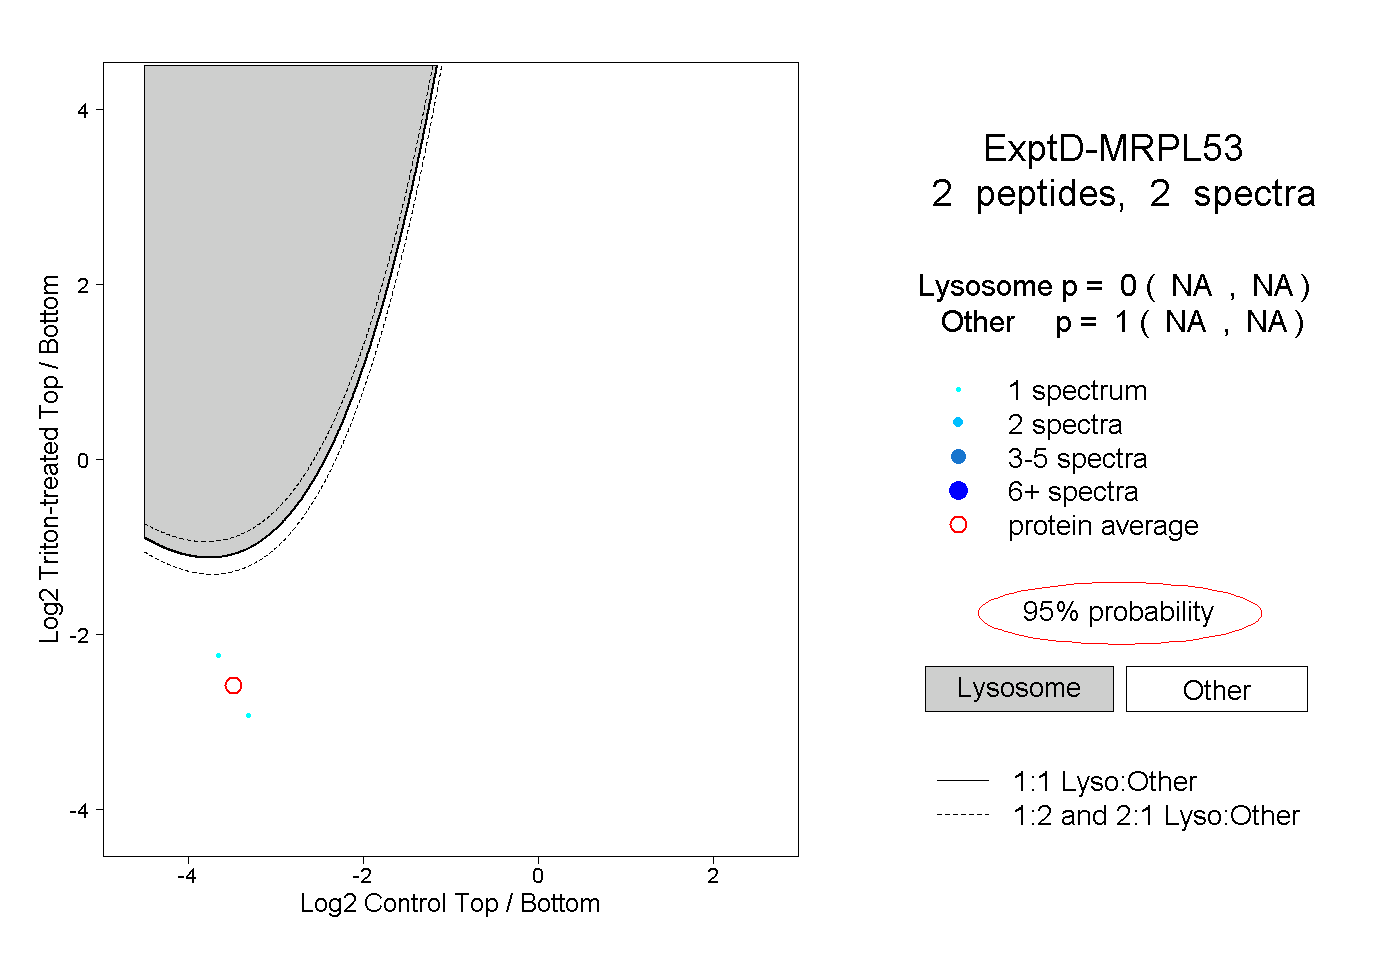
NA | NA
NA | NA