 15
15peptides
spectra

0.000 | 0.000
0.000 | 0.000
0.000 | 0.000
0.125 | 0.160
0.110 | 0.148
0.422 | 0.450
0.258 | 0.273
0.017 | 0.027
1peptide
spectrum

NA | NA
NA | NA
NA | NA
NA | NA
NA | NA
NA | NA
NA | NA
9peptides
spectra
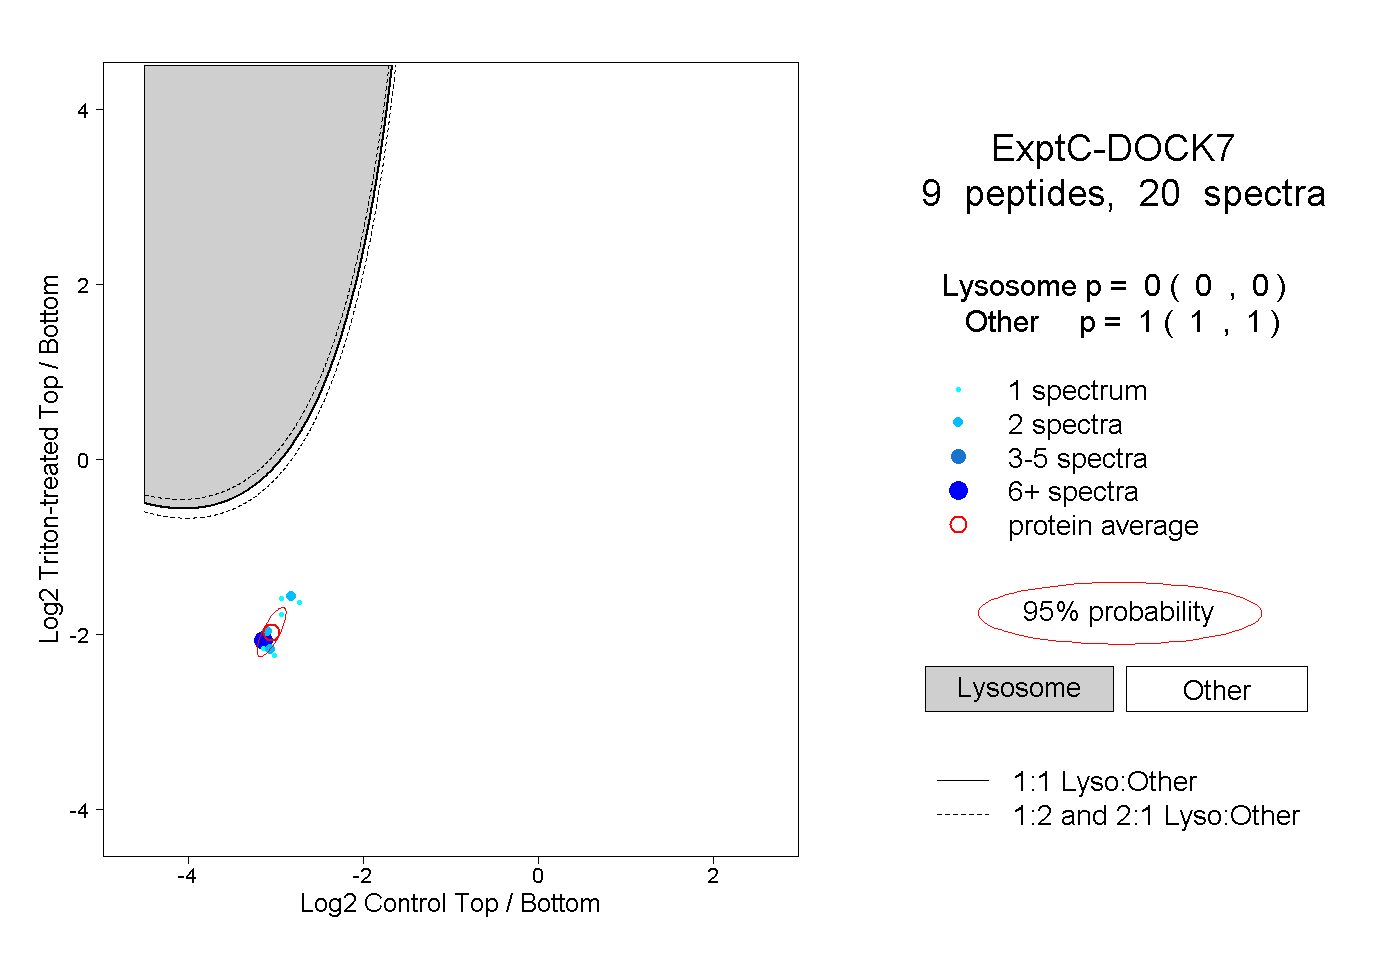
0.000 | 0.000
1.000 | 1.000
