 12
12peptides
spectra
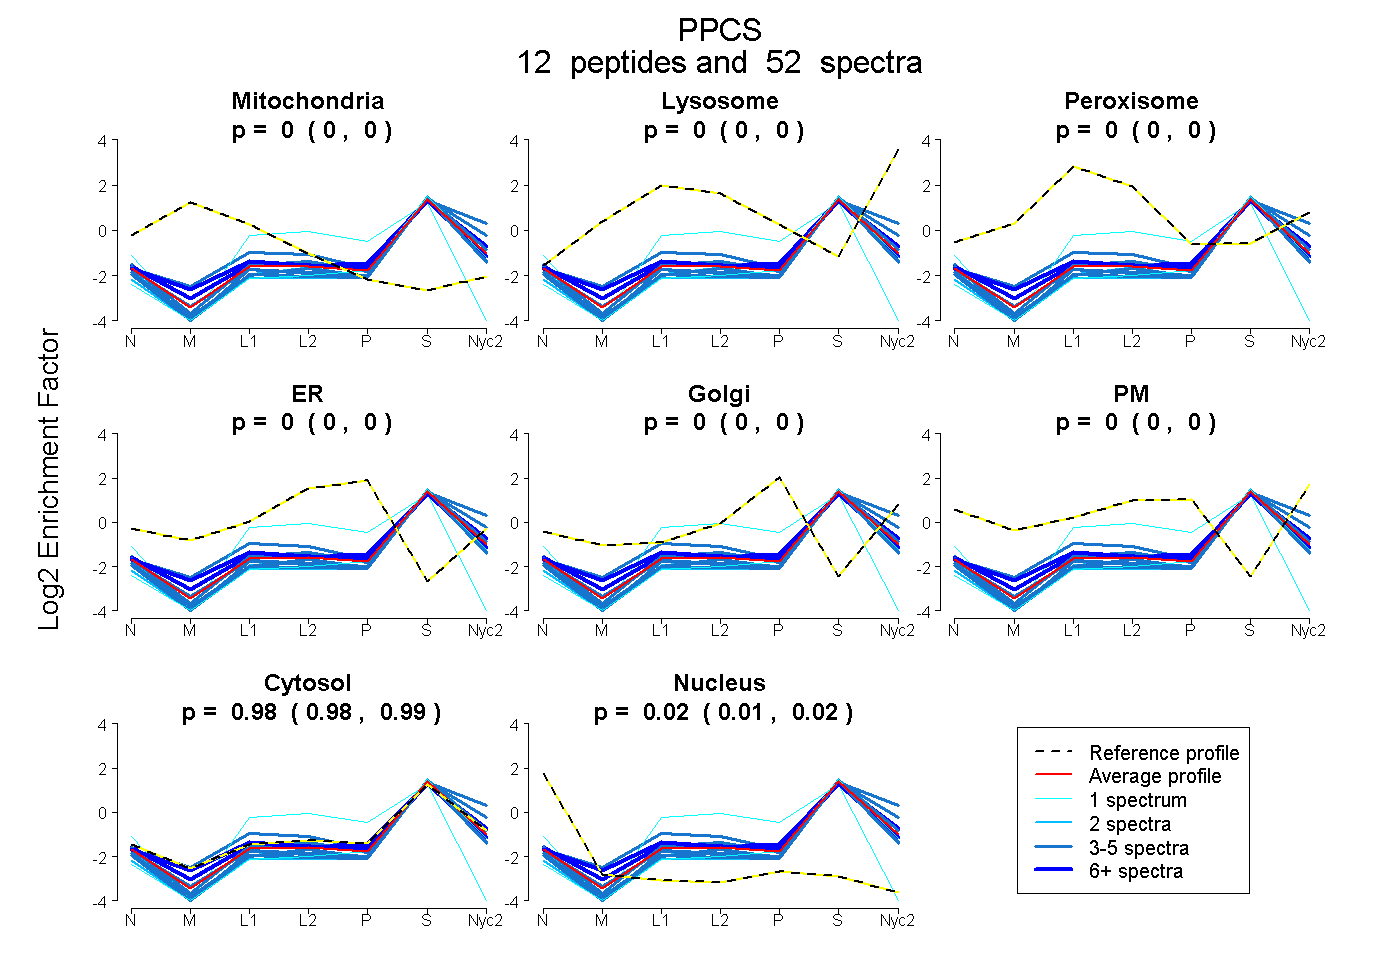
0.000 | 0.000
0.000 | 0.000
0.000 | 0.000
0.000 | 0.000
0.000 | 0.000
0.000 | 0.000
0.978 | 0.987
0.012 | 0.021
| Plot | Mito | Lyso | Perox | ER | Golgi | PM | Cytosol | Nucleus | |||||
| Expt A |
12 peptides |
52 spectra |
|
0.000 0.000 | 0.000 |
0.000 0.000 | 0.000 |
0.000 0.000 | 0.000 |
0.000 0.000 | 0.000 |
0.000 0.000 | 0.000 |
0.000 0.000 | 0.000 |
0.983 0.978 | 0.987 |
0.017 0.012 | 0.021 |
| 4 spectra, LETDPDIIISR | 0.000 | 0.000 | 0.000 | 0.000 | 0.000 | 0.000 | 1.000 | 0.000 | ||
| 16 spectra, IHSSGGPLQITMK | 0.000 | 0.000 | 0.000 | 0.000 | 0.000 | 0.000 | 0.977 | 0.023 | ||
| 1 spectrum, HTAFICDR | 0.000 | 0.000 | 0.000 | 0.091 | 0.000 | 0.000 | 0.808 | 0.101 | ||
| 2 spectra, AFIVSFK | 0.000 | 0.000 | 0.000 | 0.000 | 0.000 | 0.000 | 0.989 | 0.011 | ||
| 4 spectra, FLDNFSSGR | 0.000 | 0.119 | 0.000 | 0.000 | 0.000 | 0.000 | 0.881 | 0.000 | ||
| 2 spectra, LGEQGR | 0.000 | 0.000 | 0.000 | 0.000 | 0.000 | 0.000 | 0.985 | 0.015 | ||
| 5 spectra, LLLSEDEVAR | 0.000 | 0.000 | 0.000 | 0.000 | 0.000 | 0.000 | 0.943 | 0.057 | ||
| 4 spectra, VVLVTSGGTK | 0.000 | 0.000 | 0.000 | 0.000 | 0.000 | 0.000 | 0.984 | 0.016 | ||
| 4 spectra, VPLEAR | 0.000 | 0.000 | 0.000 | 0.000 | 0.000 | 0.000 | 0.941 | 0.059 | ||
| 6 spectra, MLSPLVK | 0.000 | 0.000 | 0.000 | 0.000 | 0.000 | 0.000 | 1.000 | 0.000 | ||
| 1 spectrum, WAEVMAR | 0.000 | 0.000 | 0.000 | 0.000 | 0.000 | 0.000 | 0.990 | 0.010 | ||
| 3 spectra, GMVIEEK | 0.000 | 0.000 | 0.000 | 0.000 | 0.000 | 0.000 | 0.921 | 0.079 |
| Plot | Mito | Lyso or Perox | ER | Golgi | PM | Cytosol | Nucleus | ||||||
| Expt B |
3 peptides |
14 spectra |
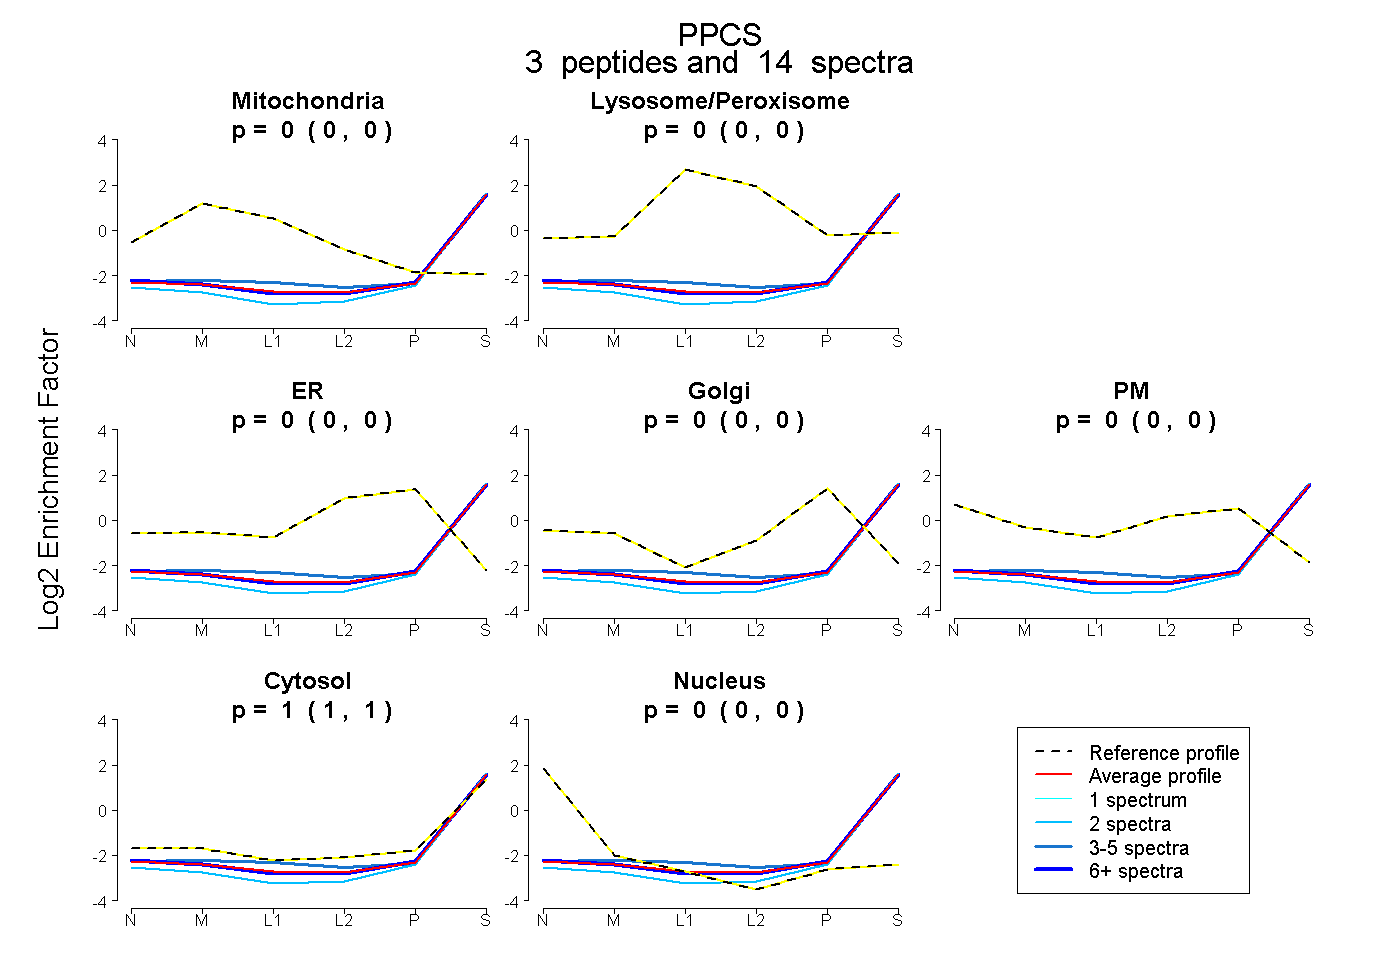 |
0.000 0.000 | 0.000 |
0.000 0.000 | 0.000 |
0.000 0.000 | 0.000 |
0.000 0.000 | 0.000 |
0.000 0.000 | 0.000 |
1.000 1.000 | 1.000 |
0.000 0.000 | 0.000 |
|||
| Plot | Lyso | Other | |||||||||||
| Expt C |
10 peptides |
52 spectra |
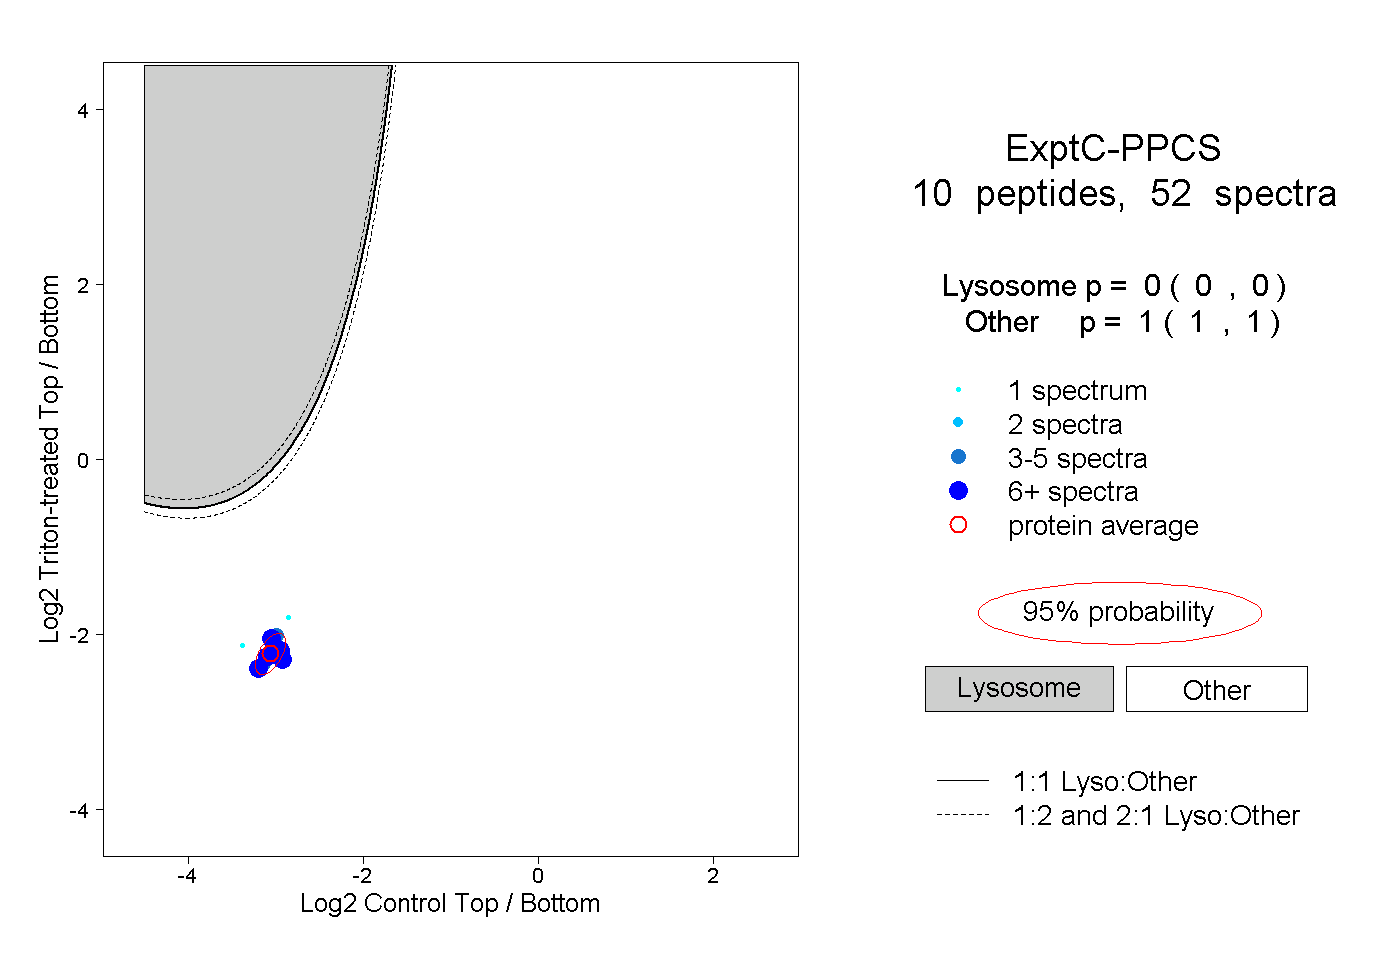 |
0.000 0.000 | 0.000 |
1.000 1.000 | 1.000 |