 5
5peptides
spectra
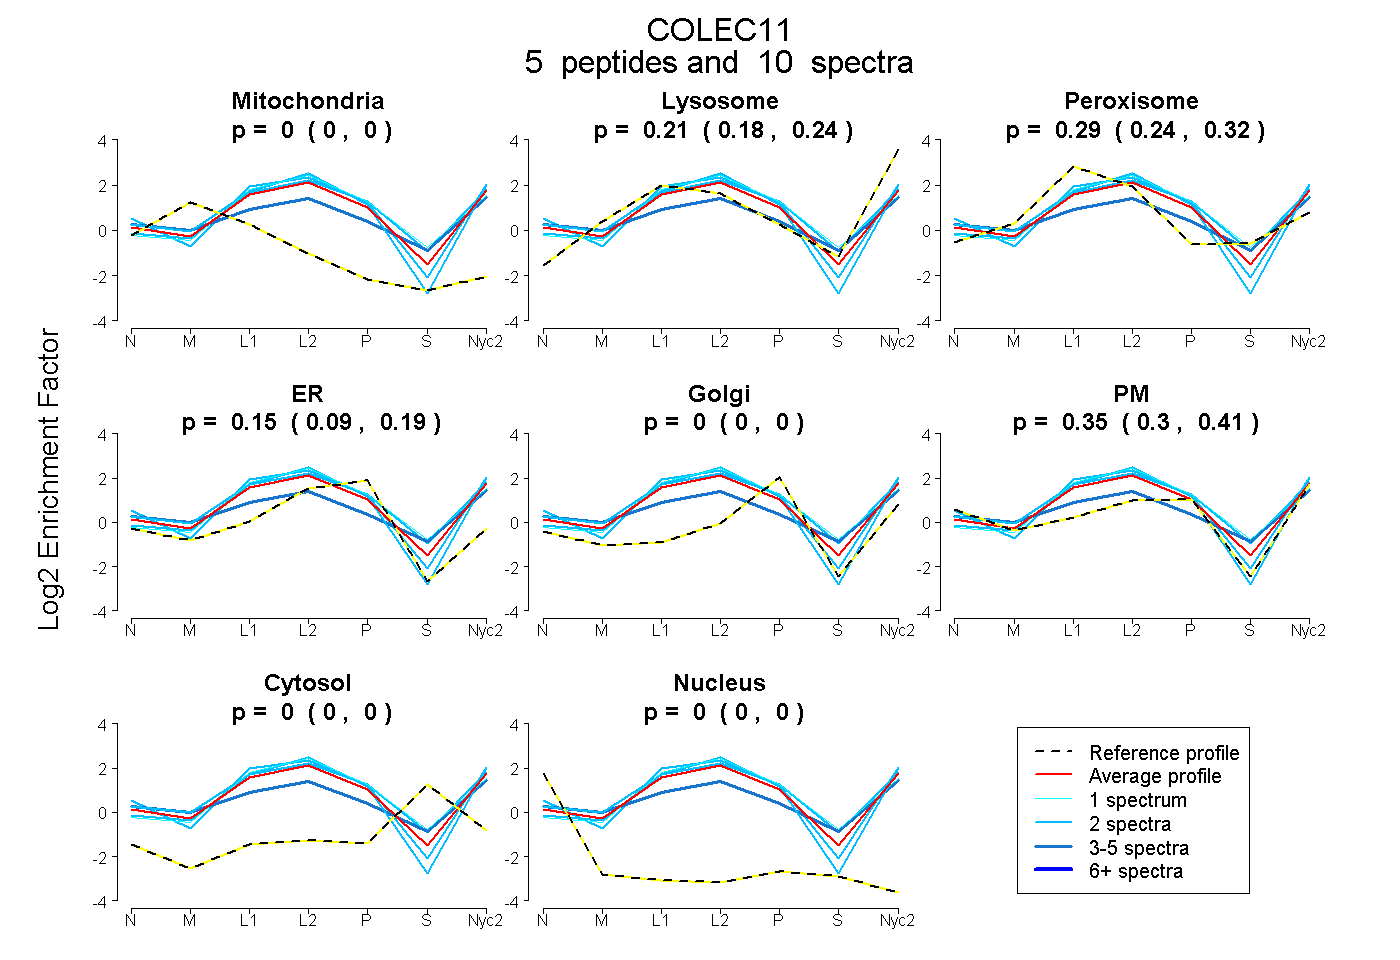
0.000 | 0.000
0.176 | 0.243
0.236 | 0.325
0.094 | 0.187
0.000 | 0.000
0.298 | 0.407
0.000 | 0.000
0.000 | 0.000
2peptides
spectra
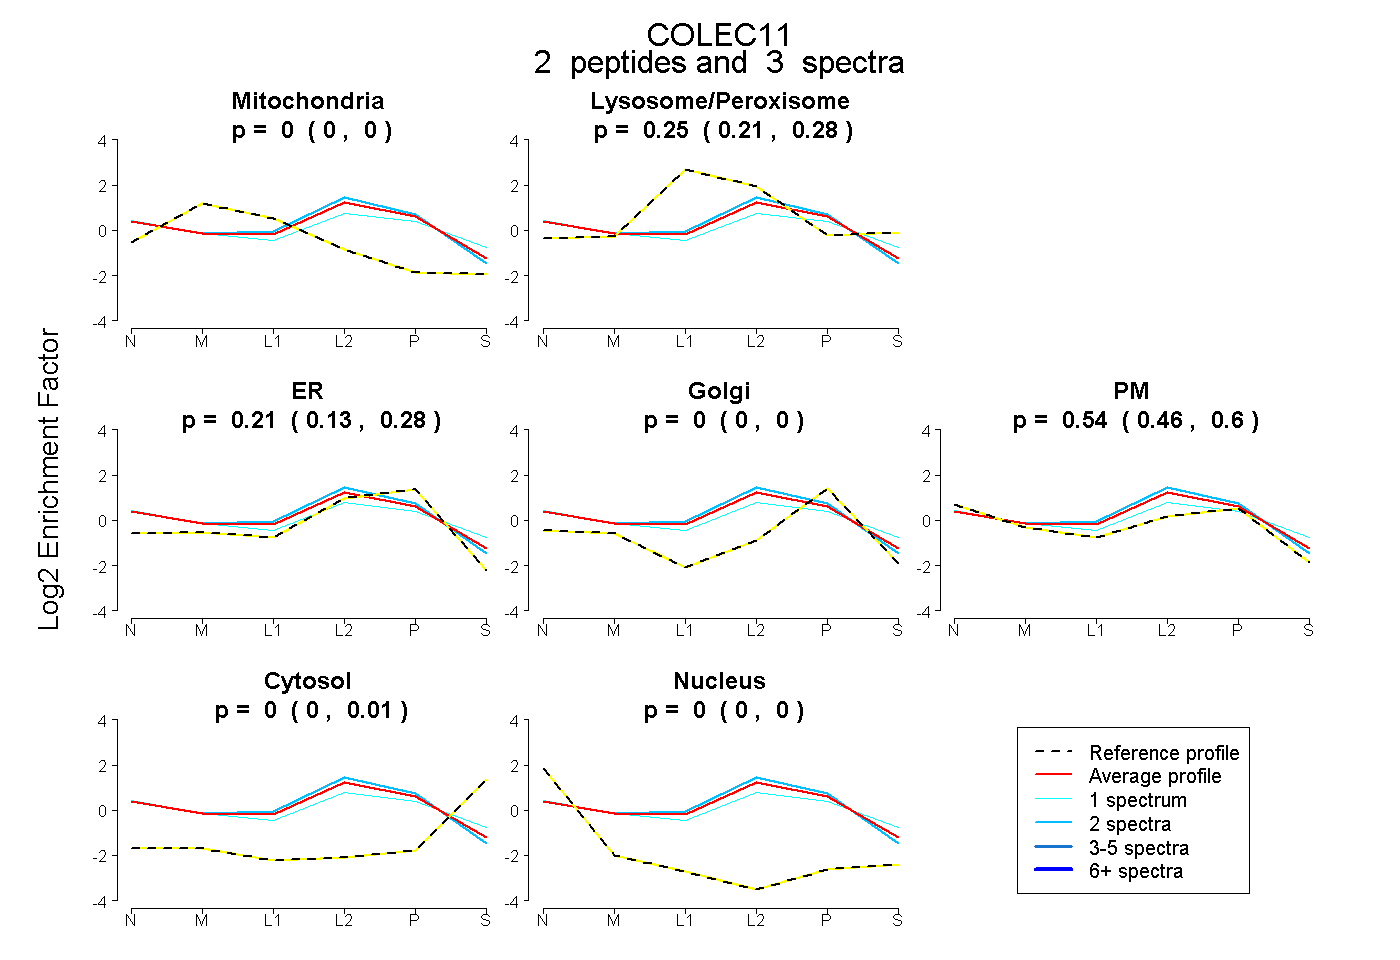
0.000 | 0.000
0.208 | 0.285
0.130 | 0.277
0.000 | 0.000
0.457 | 0.603
0.000 | 0.007
0.000 | 0.000
5peptides
spectra
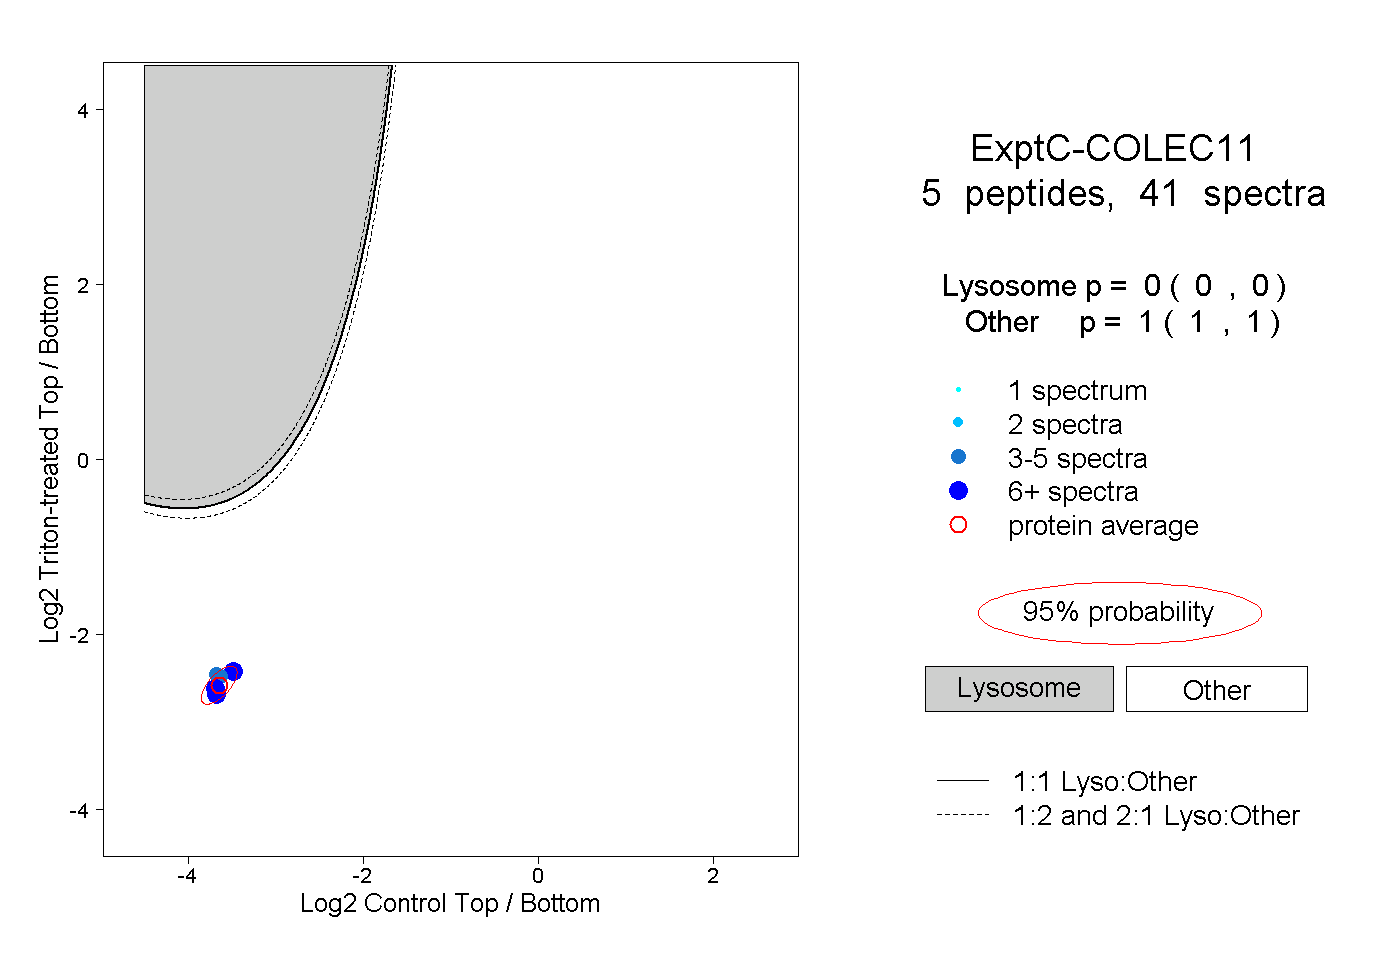
0.000 | 0.000
1.000 | 1.000