 6
6peptides
spectra
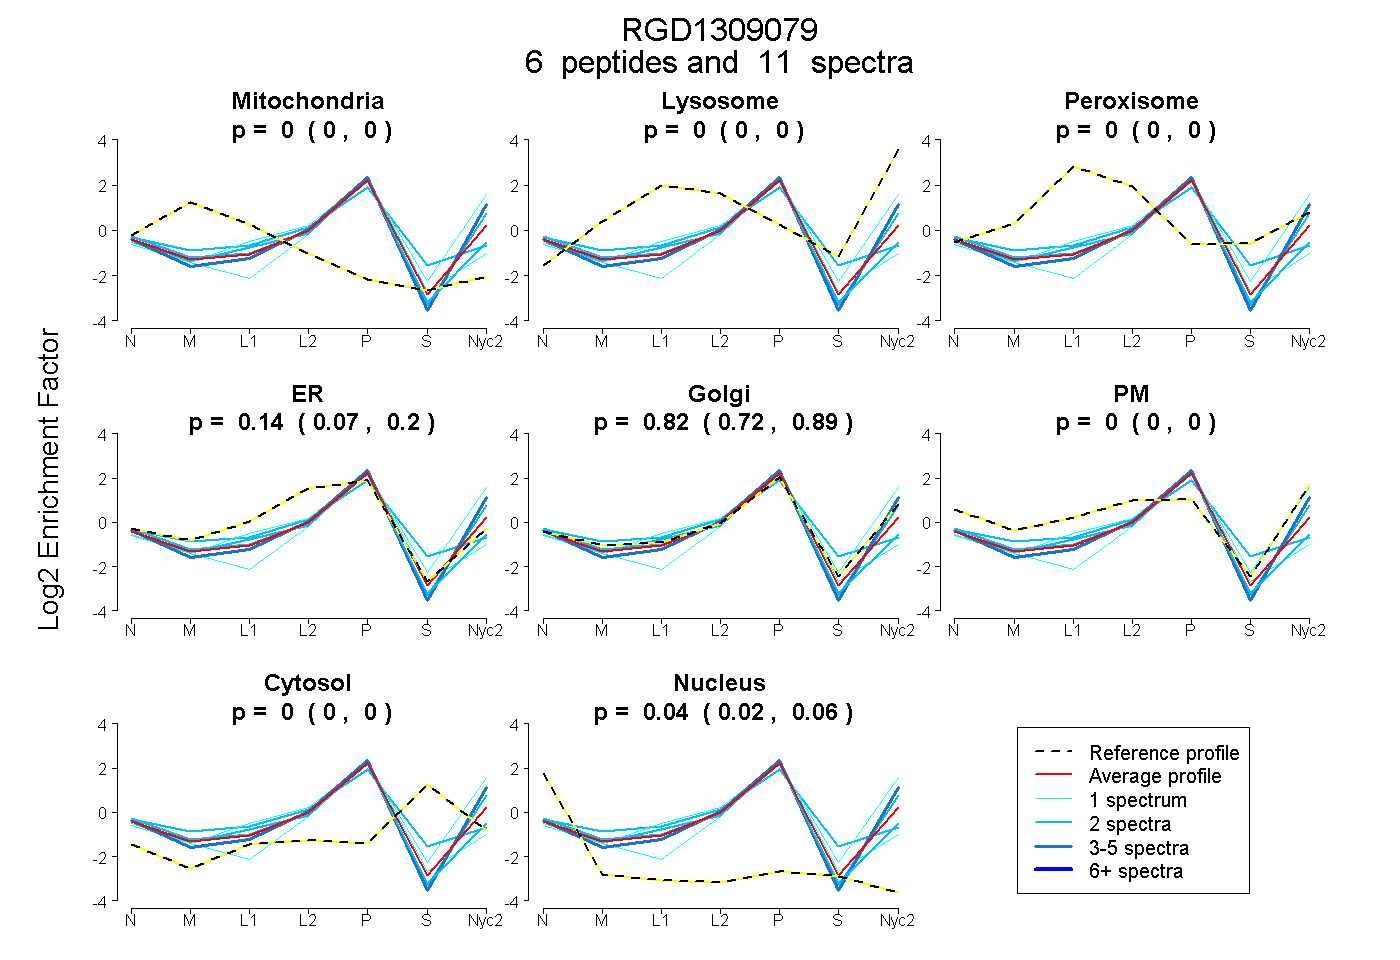
0.000 | 0.000
0.000 | 0.000
0.000 | 0.000
0.069 | 0.199
0.725 | 0.889
0.000 | 0.000
0.000 | 0.000
0.025 | 0.062
2peptides
spectra
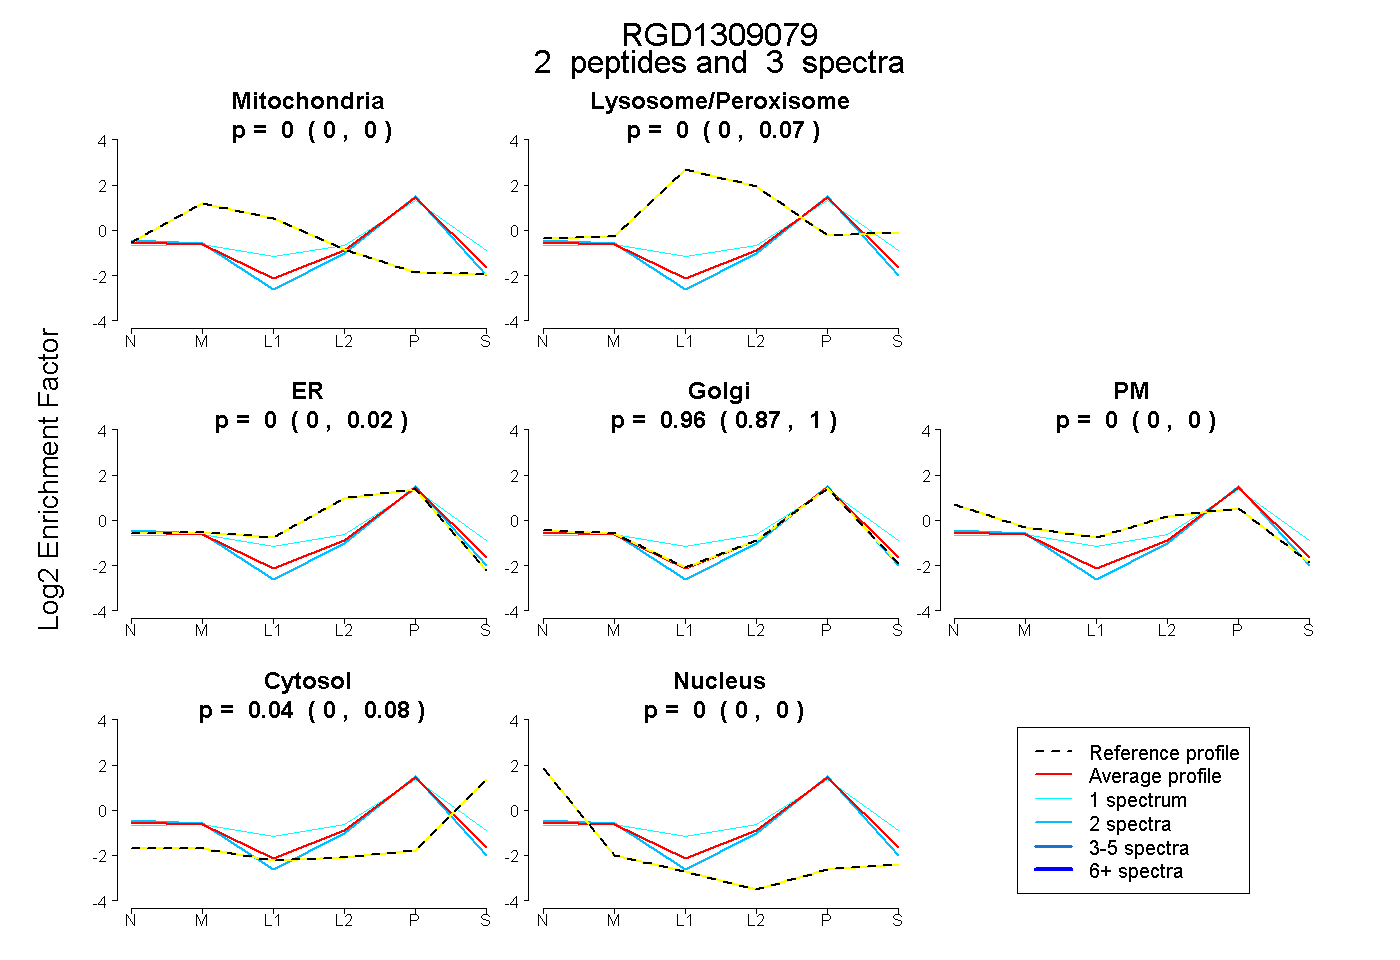
0.000 | 0.000
0.000 | 0.069
0.000 | 0.021
0.868 | 0.996
0.000 | 0.000
0.000 | 0.077
0.000 | 0.000
4peptides
spectra
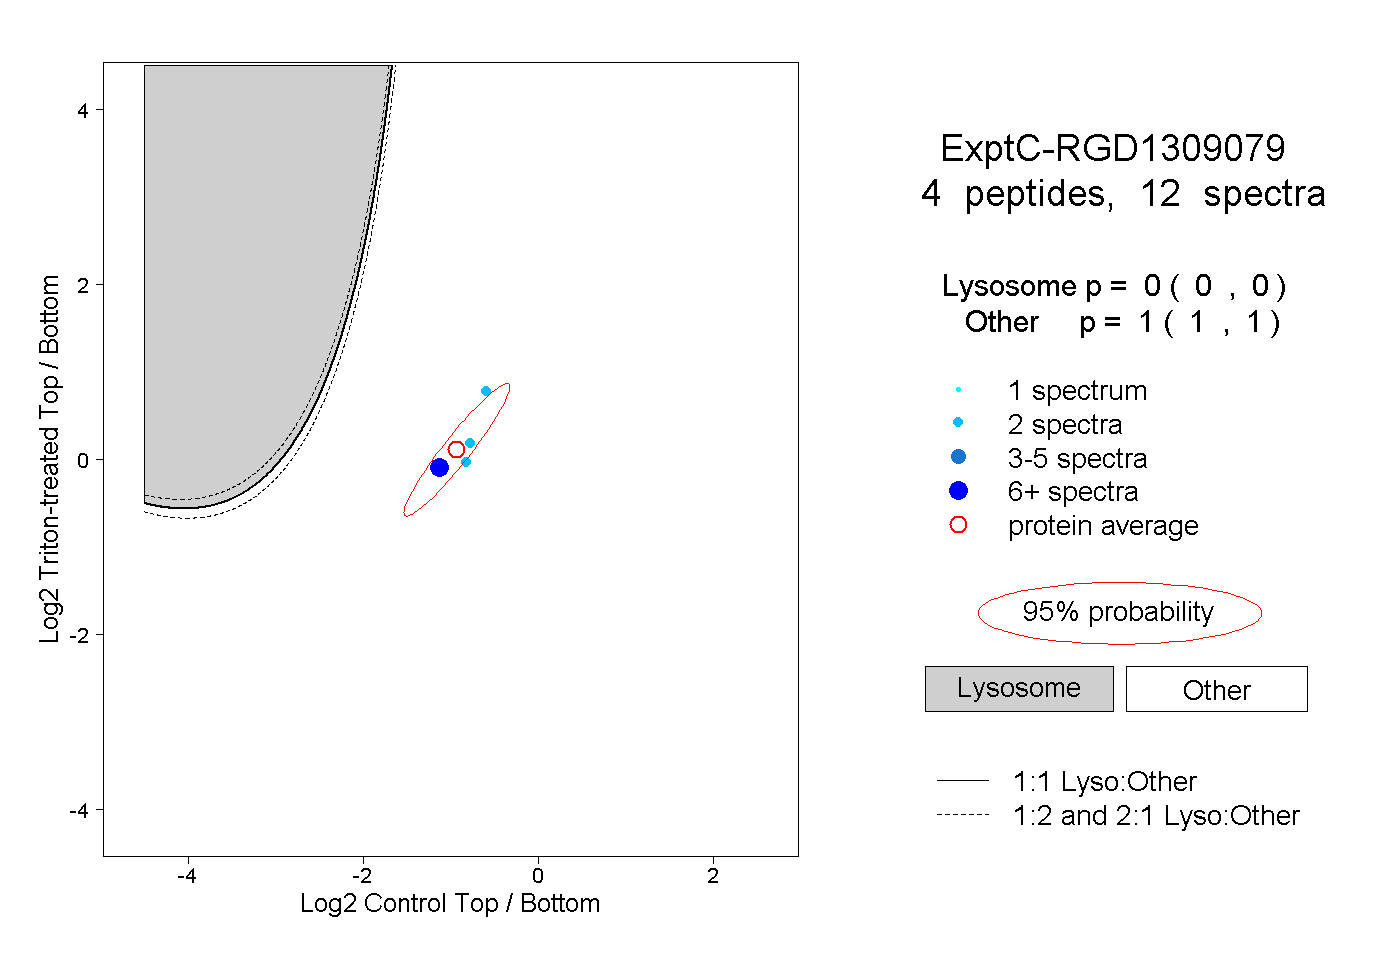
0.000 | 0.000
1.000 | 1.000