 13
13peptides
spectra
0.000 | 0.000
0.000 | 0.000
0.000 | 0.000
0.000 | 0.000
0.072 | 0.114
0.661 | 0.690
0.002 | 0.057
0.181 | 0.208
| Plot | Mito | Lyso | Perox | ER | Golgi | PM | Cytosol | Nucleus | |||||
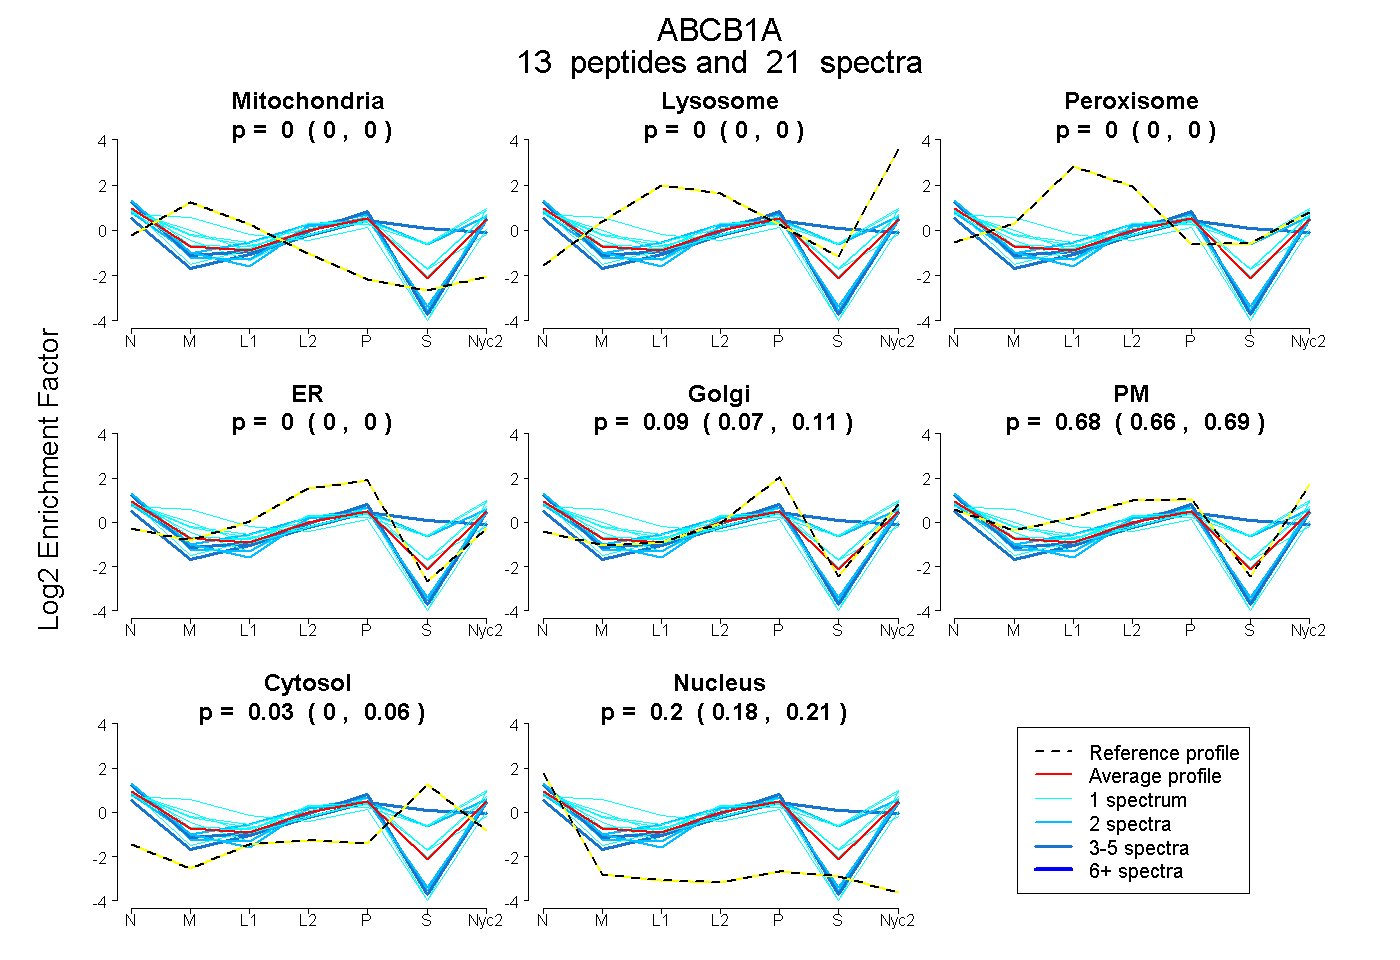
| Expt A |
13 peptides |
21 spectra |
|
0.000 0.000 | 0.000 |
0.000 0.000 | 0.000 |
0.000 0.000 | 0.000 |
0.000 0.000 | 0.000 |
0.095 0.072 | 0.114 |
0.677 0.661 | 0.690 |
0.033 0.002 | 0.057 |
0.195 0.181 | 0.208 |
| 1 spectrum, TVIAFGGQK | 0.369 | 0.000 | 0.000 | 0.000 | 0.076 | 0.501 | 0.000 | 0.055 | ||
| 3 spectra, DGIDNVDMSSK | 0.000 | 0.000 | 0.000 | 0.045 | 0.080 | 0.347 | 0.491 | 0.036 | ||
| 1 spectrum, QLNVQWLR | 0.061 | 0.000 | 0.000 | 0.000 | 0.032 | 0.693 | 0.095 | 0.119 | ||
| 1 spectrum, QPHILLLDEATSALDTESEK | 0.000 | 0.000 | 0.000 | 0.000 | 0.000 | 0.639 | 0.336 | 0.025 | ||
| 1 spectrum, AGAVAEEVLAAIR | 0.000 | 0.000 | 0.000 | 0.000 | 0.000 | 0.807 | 0.000 | 0.193 | ||
| 2 spectra, ENVTMDEIEK | 0.000 | 0.000 | 0.000 | 0.000 | 0.000 | 0.650 | 0.325 | 0.025 | ||
| 1 spectrum, GPHDQDGELSTK | 0.032 | 0.000 | 0.000 | 0.079 | 0.195 | 0.426 | 0.070 | 0.197 | ||
| 1 spectrum, YNNNLEEAK | 0.000 | 0.000 | 0.000 | 0.000 | 0.000 | 0.663 | 0.312 | 0.025 | ||
| 1 spectrum, VVGVFTK | 0.127 | 0.000 | 0.000 | 0.000 | 0.170 | 0.552 | 0.017 | 0.133 | ||
| 2 spectra, NTTGALTTR | 0.000 | 0.000 | 0.000 | 0.000 | 0.126 | 0.622 | 0.000 | 0.252 | ||
| 1 spectrum, QDISWFDDPK | 0.078 | 0.000 | 0.000 | 0.000 | 0.000 | 0.728 | 0.101 | 0.092 | ||
| 4 spectra, KPAVSVLTMFR | 0.000 | 0.000 | 0.000 | 0.008 | 0.167 | 0.605 | 0.000 | 0.220 | ||
| 2 spectra, IATEAIENFR | 0.000 | 0.000 | 0.000 | 0.000 | 0.148 | 0.626 | 0.000 | 0.226 |
| Plot | Mito | Lyso or Perox | ER | Golgi | PM | Cytosol | Nucleus | ||||||
| Expt B |
2 peptides |
2 spectra |
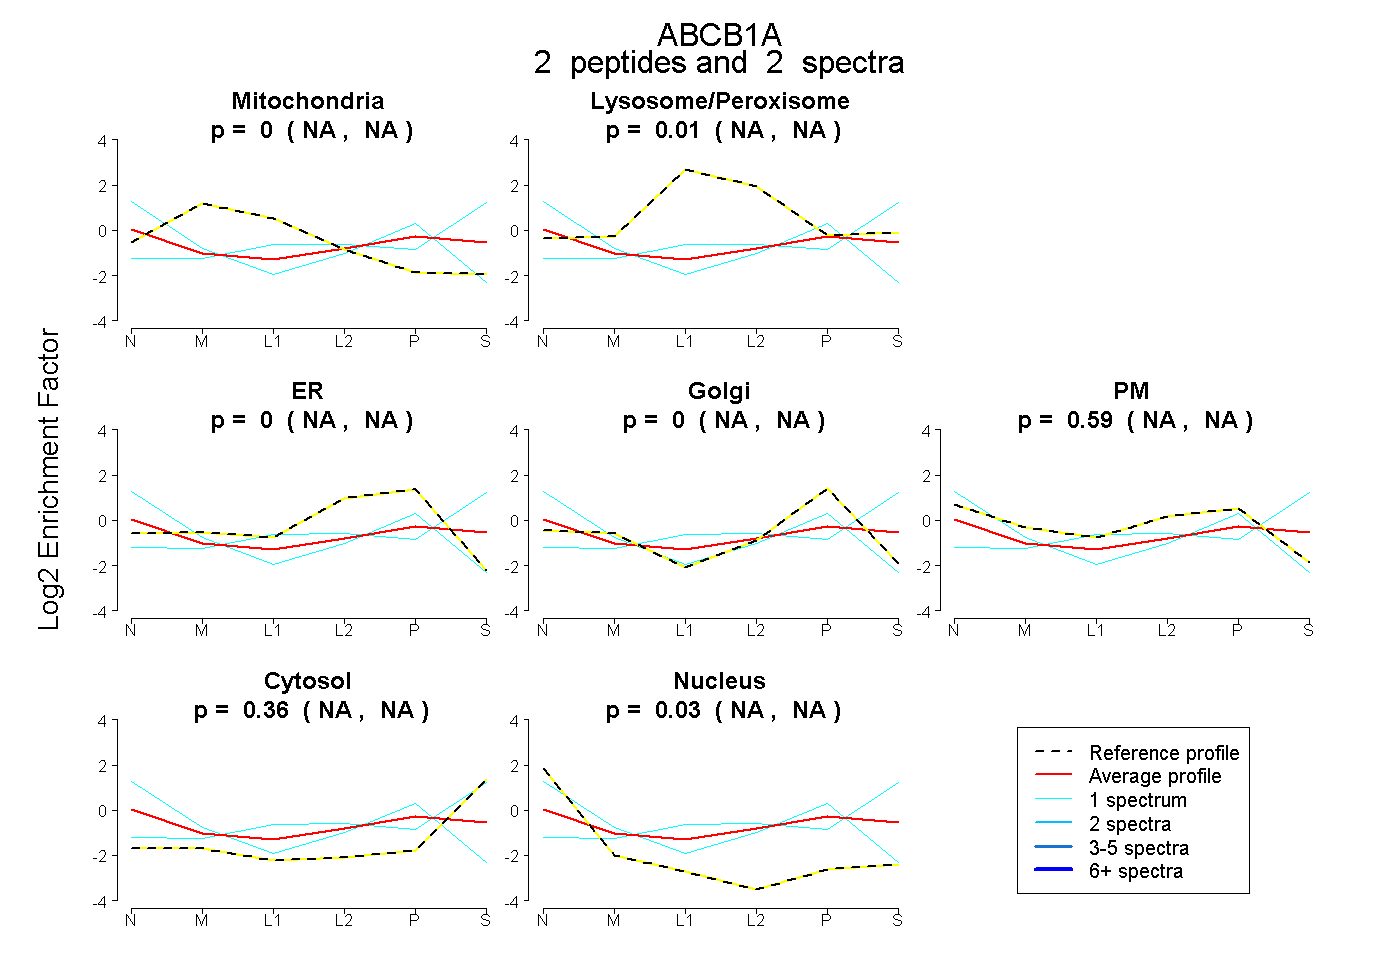 |
0.000 NA | NA |
0.015 NA | NA |
0.000 NA | NA |
0.000 NA | NA |
0.588 NA | NA |
0.363 NA | NA |
0.034 NA | NA |
|||
| Plot | Lyso | Other | |||||||||||
| Expt C |
12 peptides |
30 spectra |
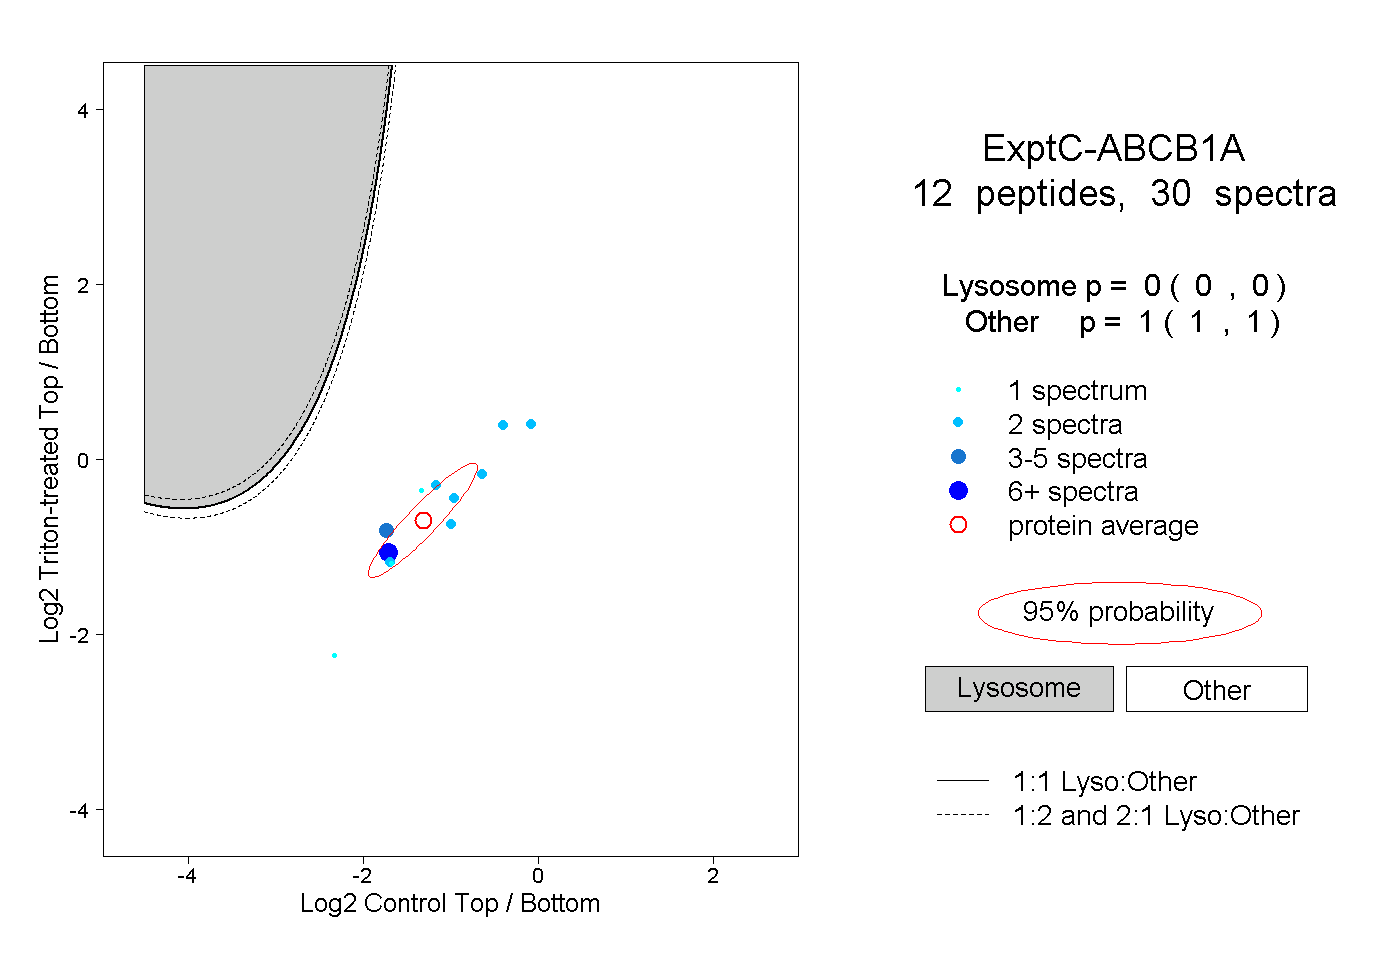 |
0.000 0.000 | 0.000 |
1.000 1.000 | 1.000 |
||||||||
| Plot | Lyso | Other | |||||||||||
| Expt D |
1 peptide |
1 spectrum |
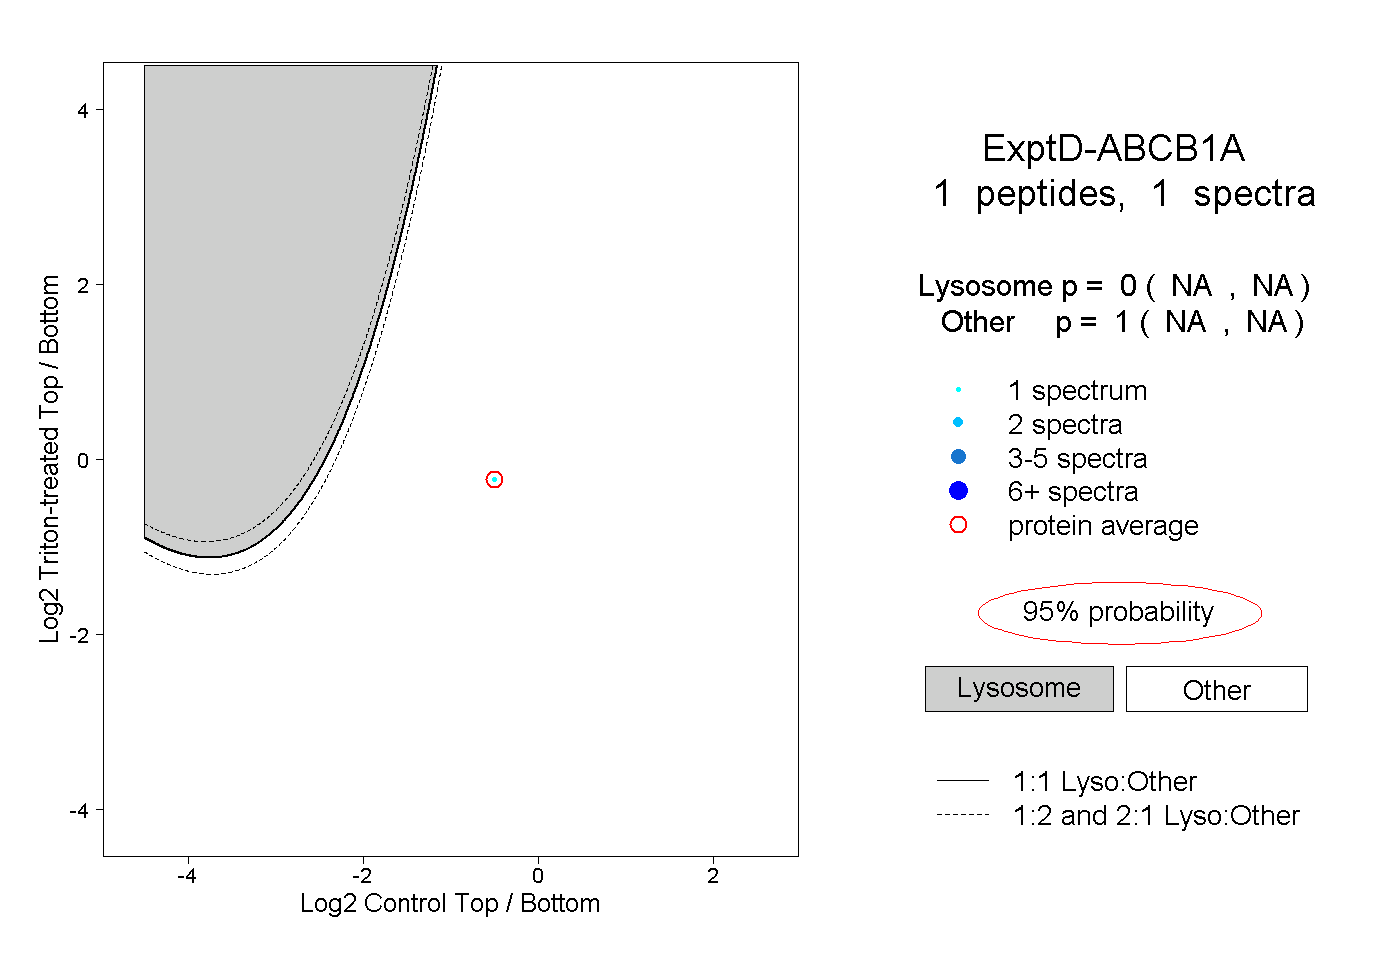 |
0.000 NA | NA |
1.000 NA | NA |