 3
3peptides
spectra
0.000 | 0.030
0.118 | 0.245
0.000 | 0.084
0.000 | 0.000
0.000 | 0.105
0.000 | 0.155
0.607 | 0.717
0.000 | 0.000
1peptide
spectrum
NA | NA
NA | NA
NA | NA
NA | NA
NA | NA
NA | NA
NA | NA
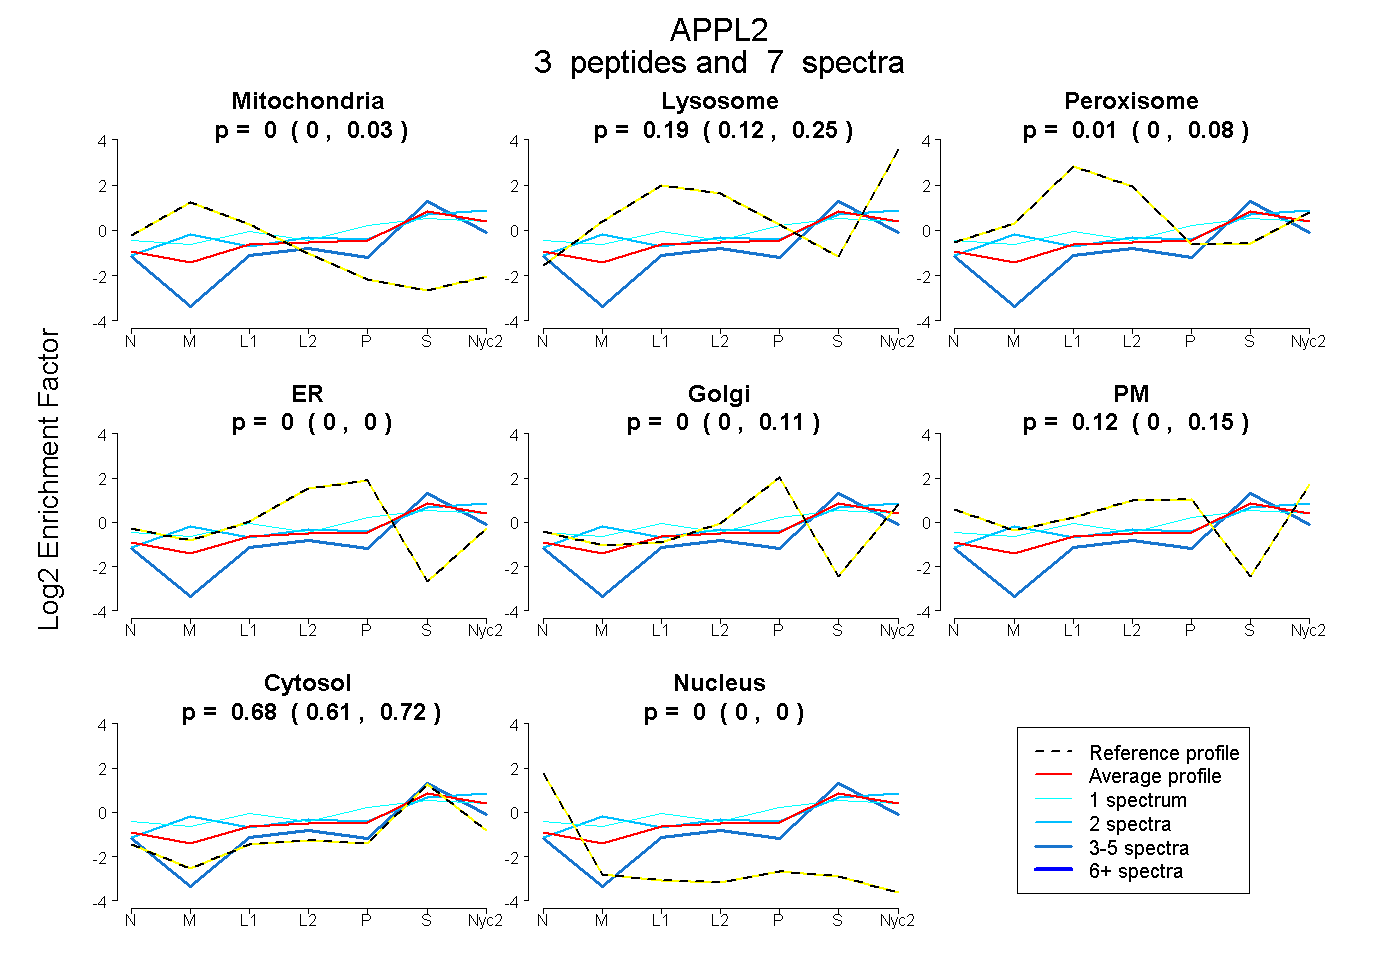
| Plot | Mito | Lyso | Perox | ER | Golgi | PM | Cytosol | Nucleus | |||||
| Expt A |
3 peptides |
7 spectra |
|
0.000 0.000 | 0.030 |
0.189 0.118 | 0.245 |
0.008 0.000 | 0.084 |
0.000 0.000 | 0.000 |
0.000 0.000 | 0.105 |
0.120 0.000 | 0.155 |
0.683 0.607 | 0.717 |
0.000 0.000 | 0.000 |
||
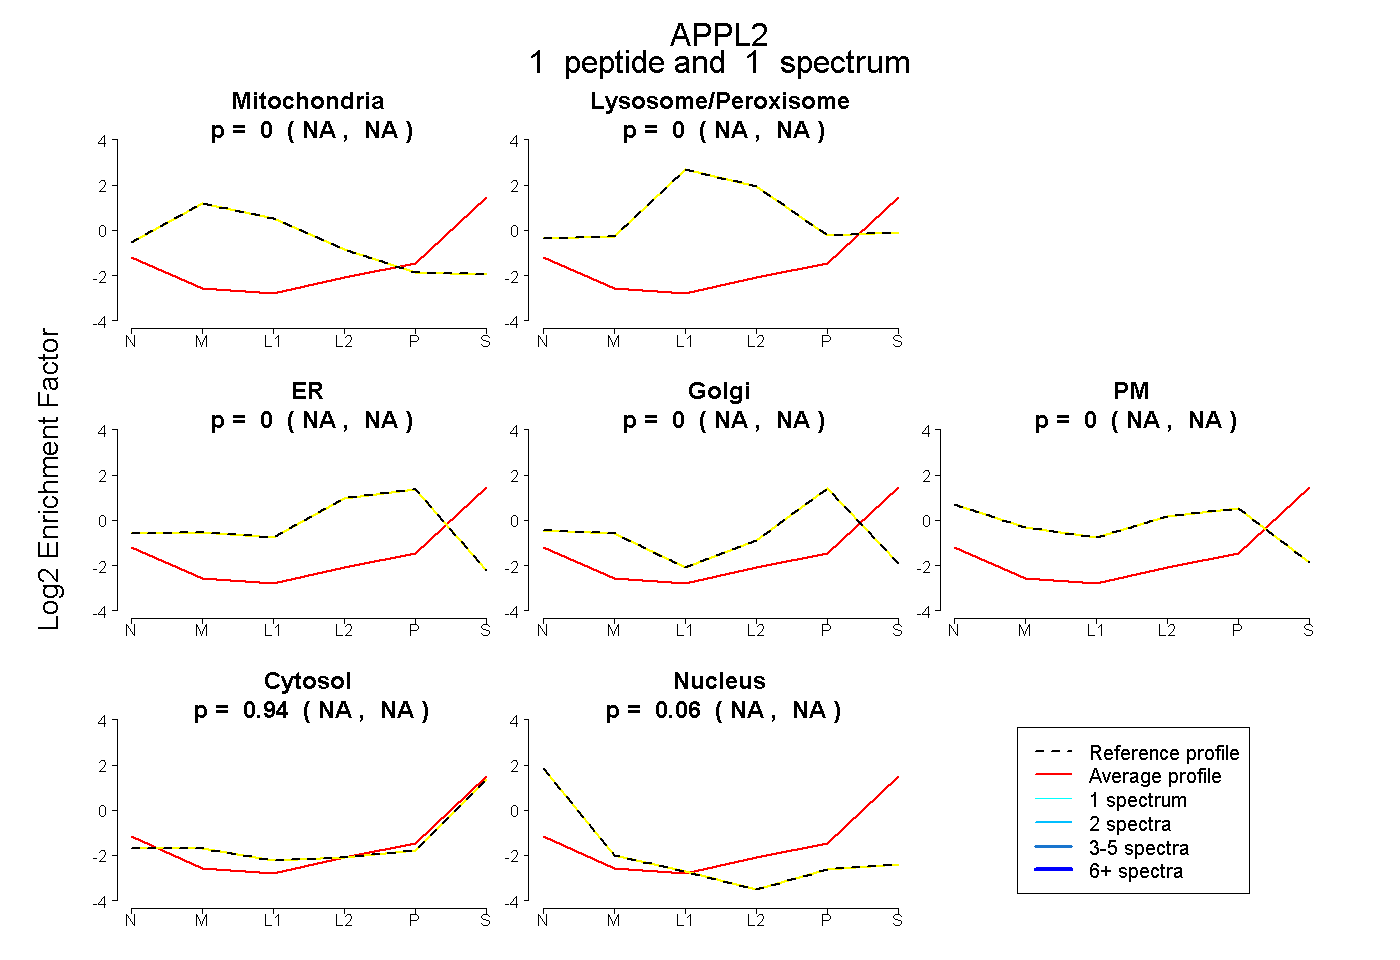
| Plot | Mito | Lyso or Perox | ER | Golgi | PM | Cytosol | Nucleus | ||||||
| Expt B |
1 peptide |
1 spectrum |
|
0.000 NA | NA |
0.000 NA | NA |
0.000 NA | NA |
0.000 NA | NA |
0.000 NA | NA |
0.941 NA | NA |
0.059 NA | NA |
| 1 spectrum, LVGFVLR | 0.000 | 0.000 | 0.000 | 0.000 | 0.000 | 0.941 | 0.059 |
| Plot | Lyso | Other | |||||||||||
| Expt C |
2 peptides |
3 spectra |
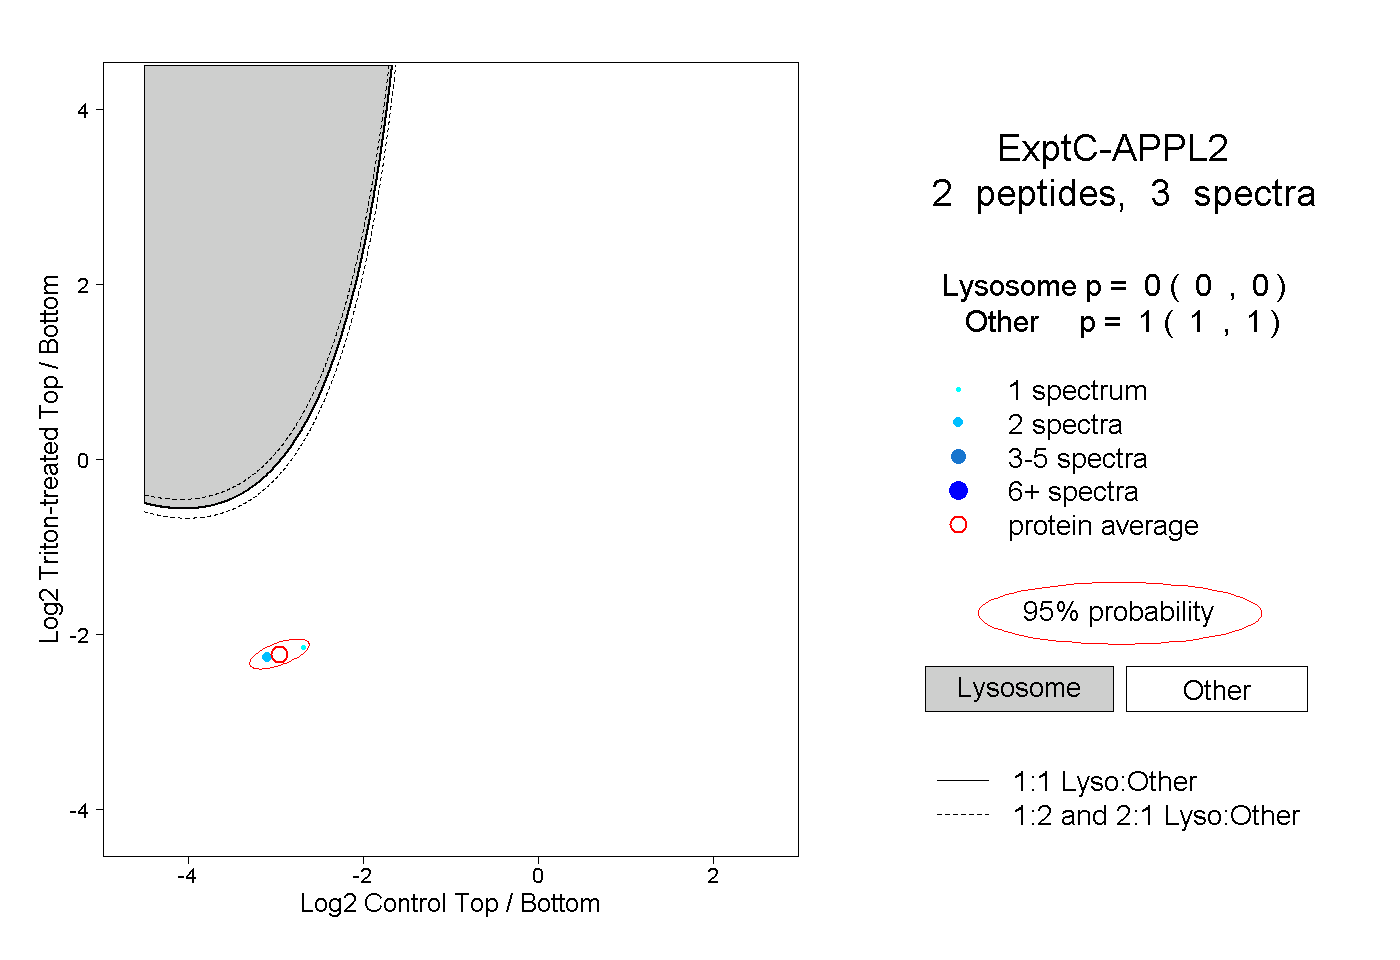 |
0.000 0.000 | 0.000 |
1.000 1.000 | 1.000 |