19
19peptides
spectra
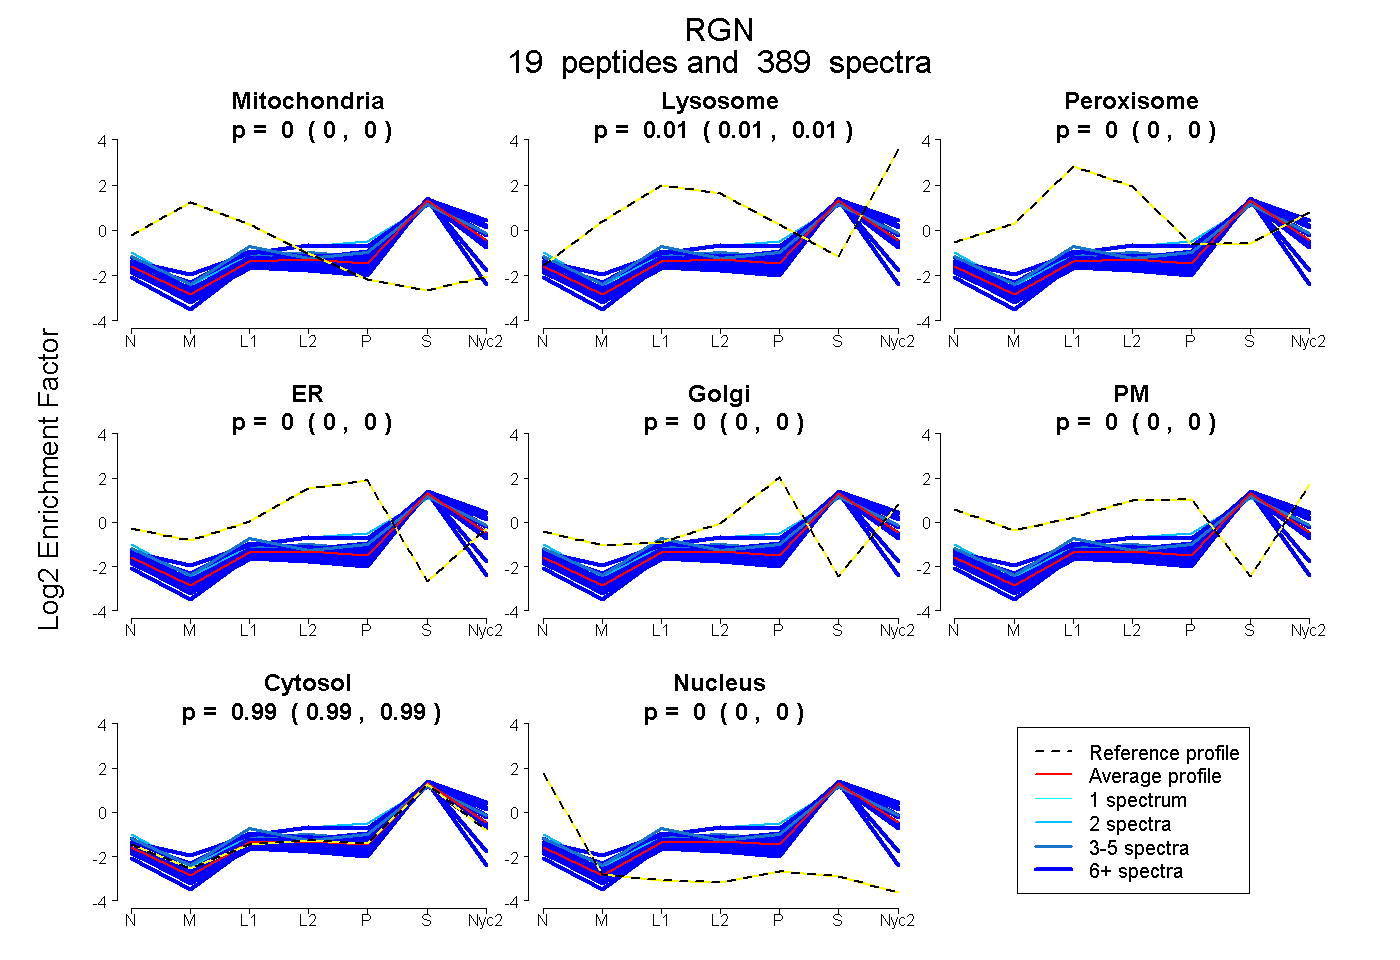
0.000 | 0.000
0.011 | 0.014
0.000 | 0.000
0.000 | 0.000
0.000 | 0.000
0.000 | 0.000
0.986 | 0.989
0.000 | 0.000
14peptides
spectra
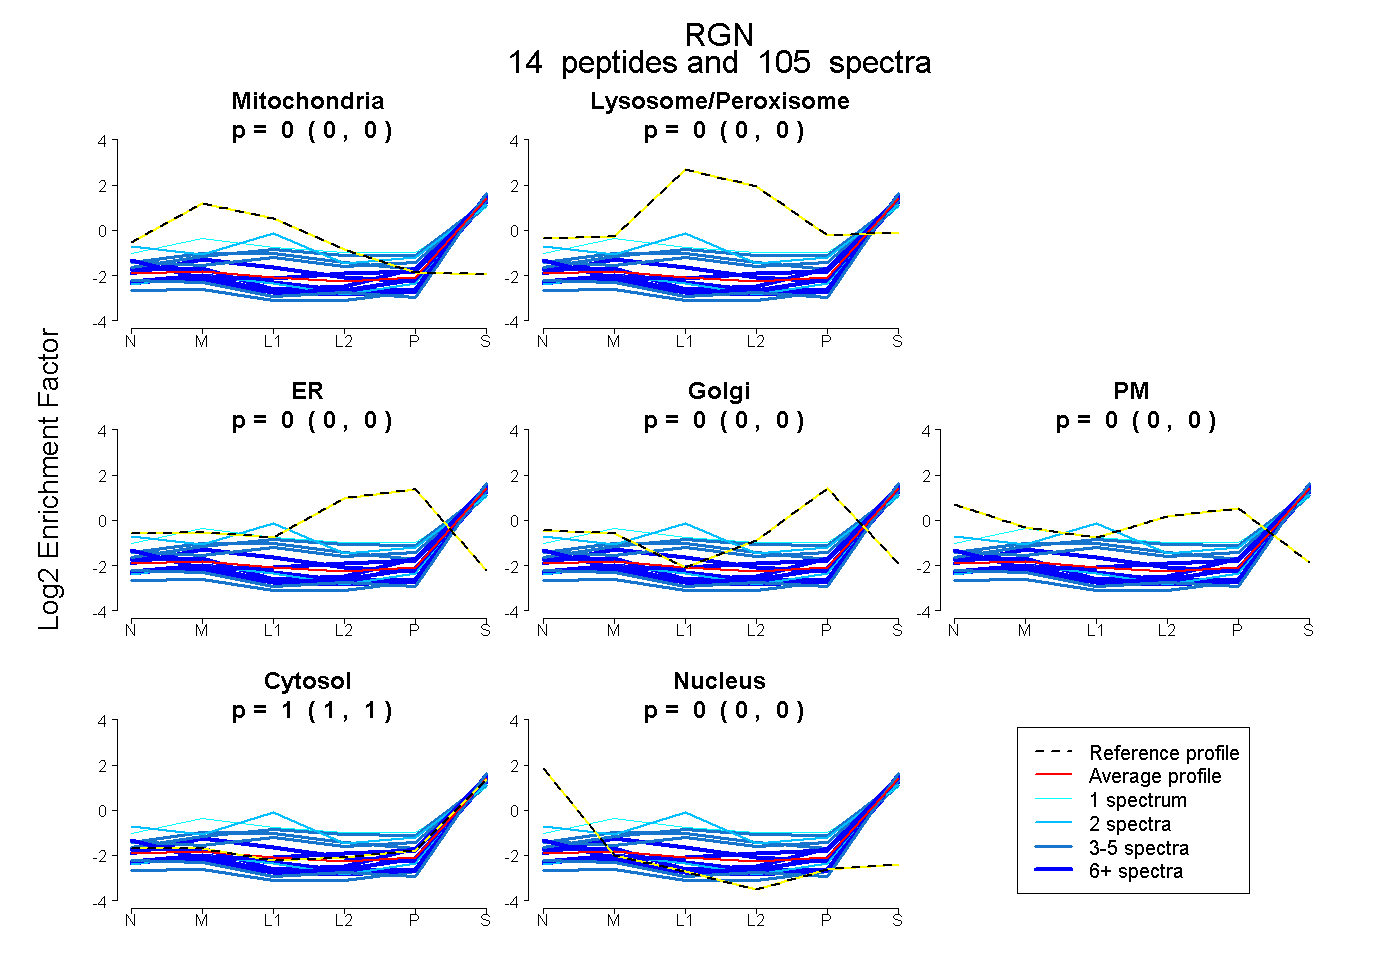
0.000 | 0.000
0.000 | 0.000
0.000 | 0.000
0.000 | 0.000
0.000 | 0.000
1.000 | 1.000
0.000 | 0.000
16peptides
spectra

0.000 | 0.000
1.000 | 1.000