| 4 spectra, QSGGYVATIGTK |
0.000 |
|
0.169 |
|
0.000 |
0.000 |
0.000 |
0.831 |
0.000 |
|
| 7 spectra, IECVLR |
0.000 |
|
0.000 |
|
0.000 |
0.000 |
0.000 |
1.000 |
0.000 |
|
| 3 spectra, HQGSLYSLFPDHSVK |
0.000 |
|
0.259 |
|
0.000 |
0.000 |
0.000 |
0.741 |
0.000 |
|
| 26 spectra, VGVDAPVSSVALR |
0.000 |
|
0.000 |
|
0.000 |
0.000 |
0.000 |
1.000 |
0.000 |
|
| 8 spectra, CGESPVWEEASK |
0.098 |
|
0.000 |
|
0.000 |
0.000 |
0.000 |
0.902 |
0.000 |
|
| 2 spectra, VDPAGR |
0.000 |
|
0.333 |
|
0.000 |
0.000 |
0.000 |
0.615 |
0.052 |
|
| 7 spectra, WDSISNR |
0.000 |
|
0.019 |
|
0.000 |
0.000 |
0.000 |
0.955 |
0.026 |
|
| 5 spectra, CLLFVDIPSK |
0.093 |
|
0.157 |
|
0.000 |
0.000 |
0.000 |
0.750 |
0.000 |
|
| 5 spectra, DYSEMYVTCAR |
0.000 |
|
0.000 |
|
0.000 |
0.000 |
0.000 |
1.000 |
0.000 |
|
| 2 spectra, QPDAGNIFK |
0.000 |
|
0.000 |
|
0.000 |
0.000 |
0.000 |
1.000 |
0.000 |
|
| 1 spectrum, GIAPYSYAG |
0.100 |
|
0.252 |
|
0.000 |
0.048 |
0.000 |
0.600 |
0.000 |
|
| 3 spectra, YFDQVDISNGLDWSLDHK |
0.000 |
|
0.000 |
|
0.000 |
0.000 |
0.000 |
1.000 |
0.000 |
|
| 17 spectra, DGMSAEGLLR |
0.000 |
|
0.000 |
|
0.000 |
0.000 |
0.000 |
0.980 |
0.020 |
|
| 15 spectra, LWVACYNGGR |
0.000 |
|
0.000 |
|
0.000 |
0.000 |
0.000 |
1.000 |
0.000 |
|
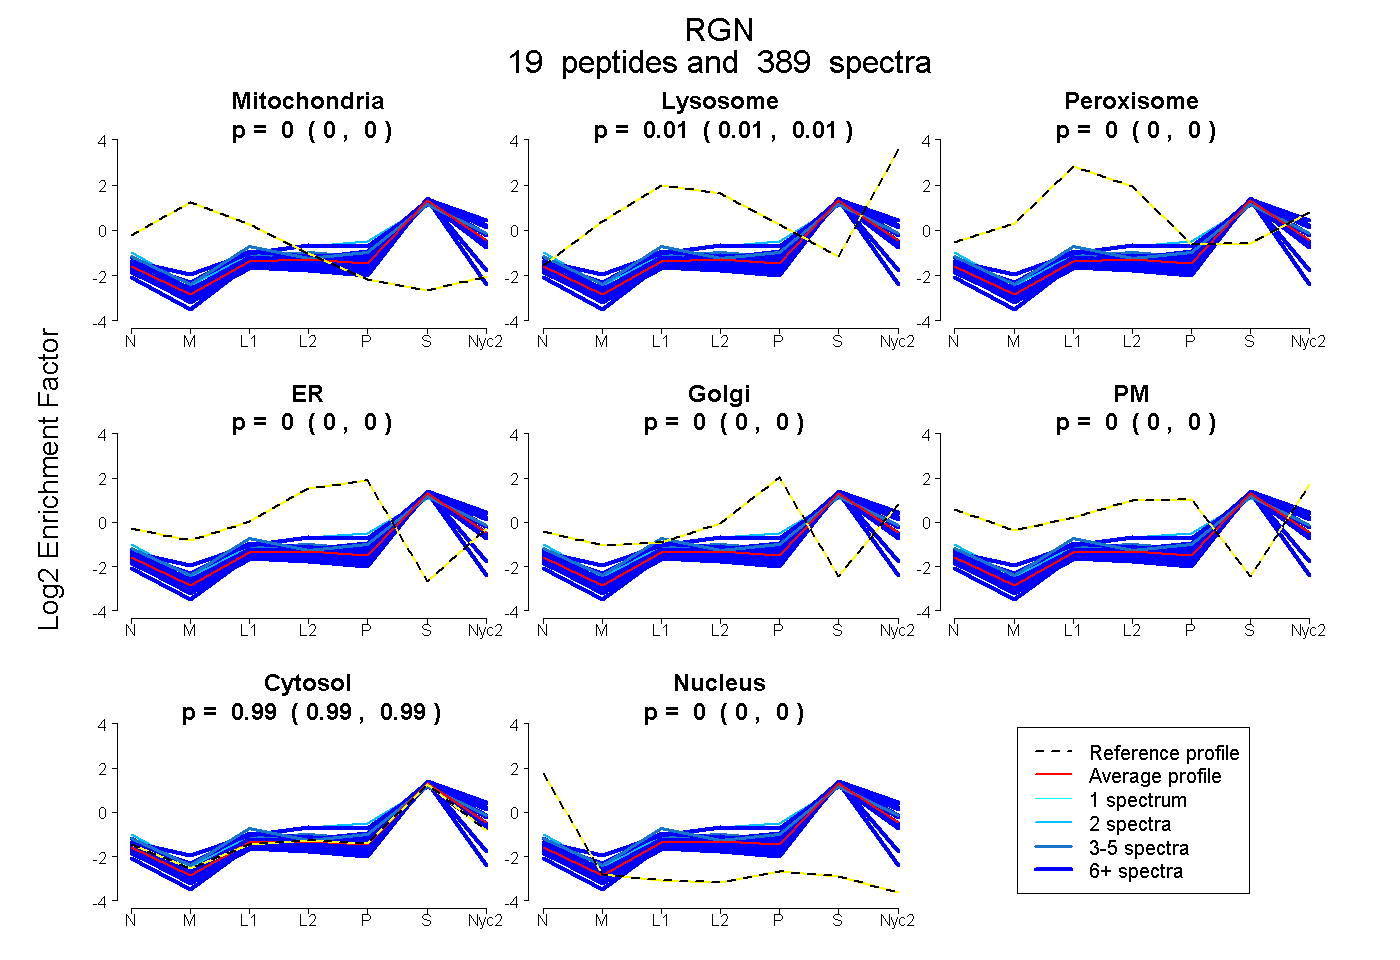
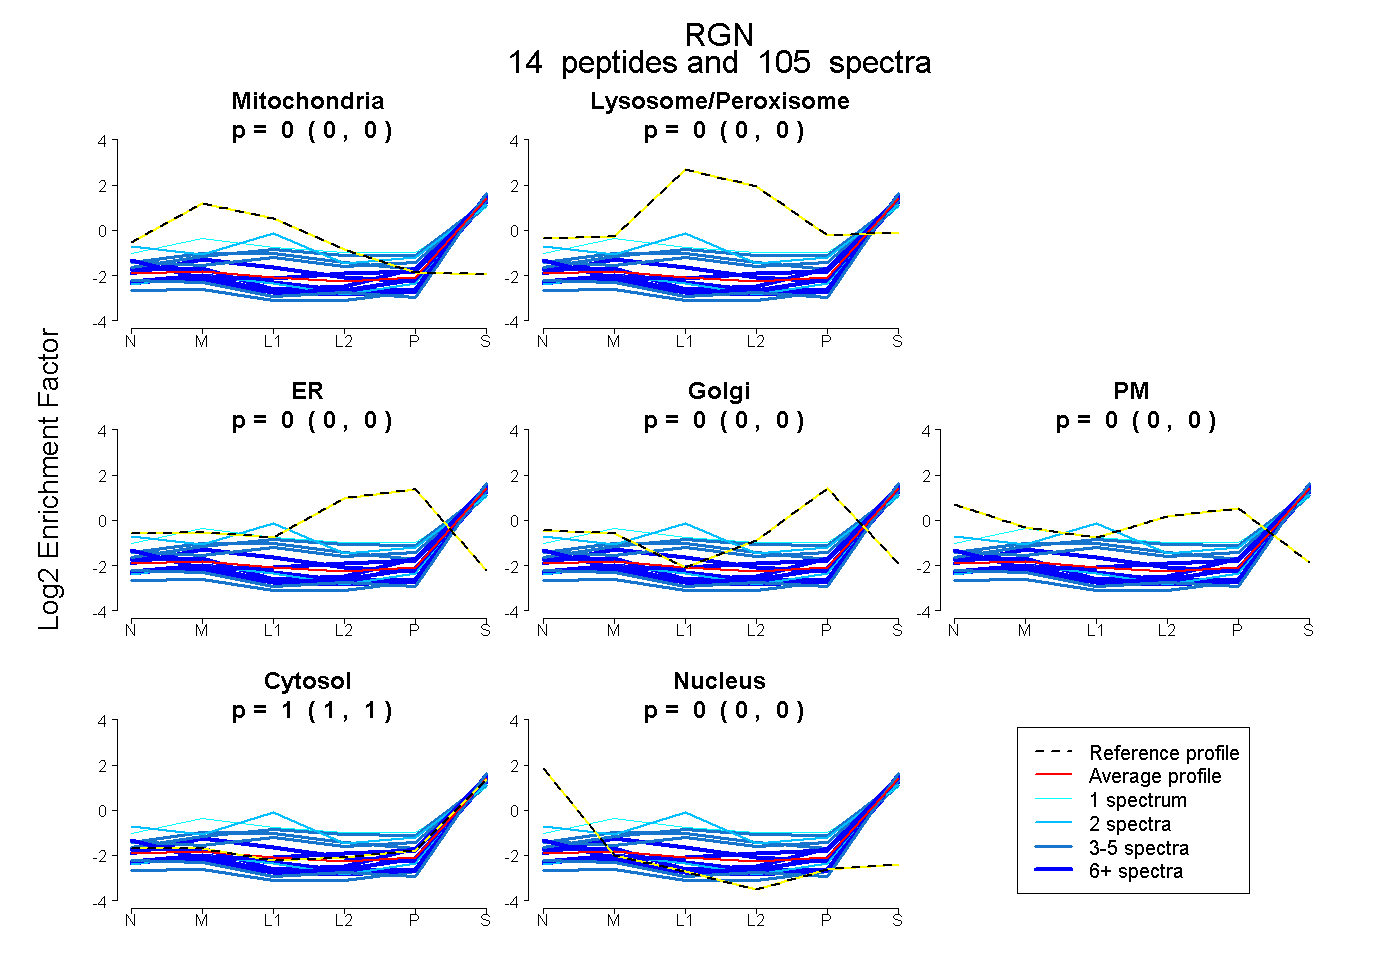
 19
19