 6
6peptides
spectra
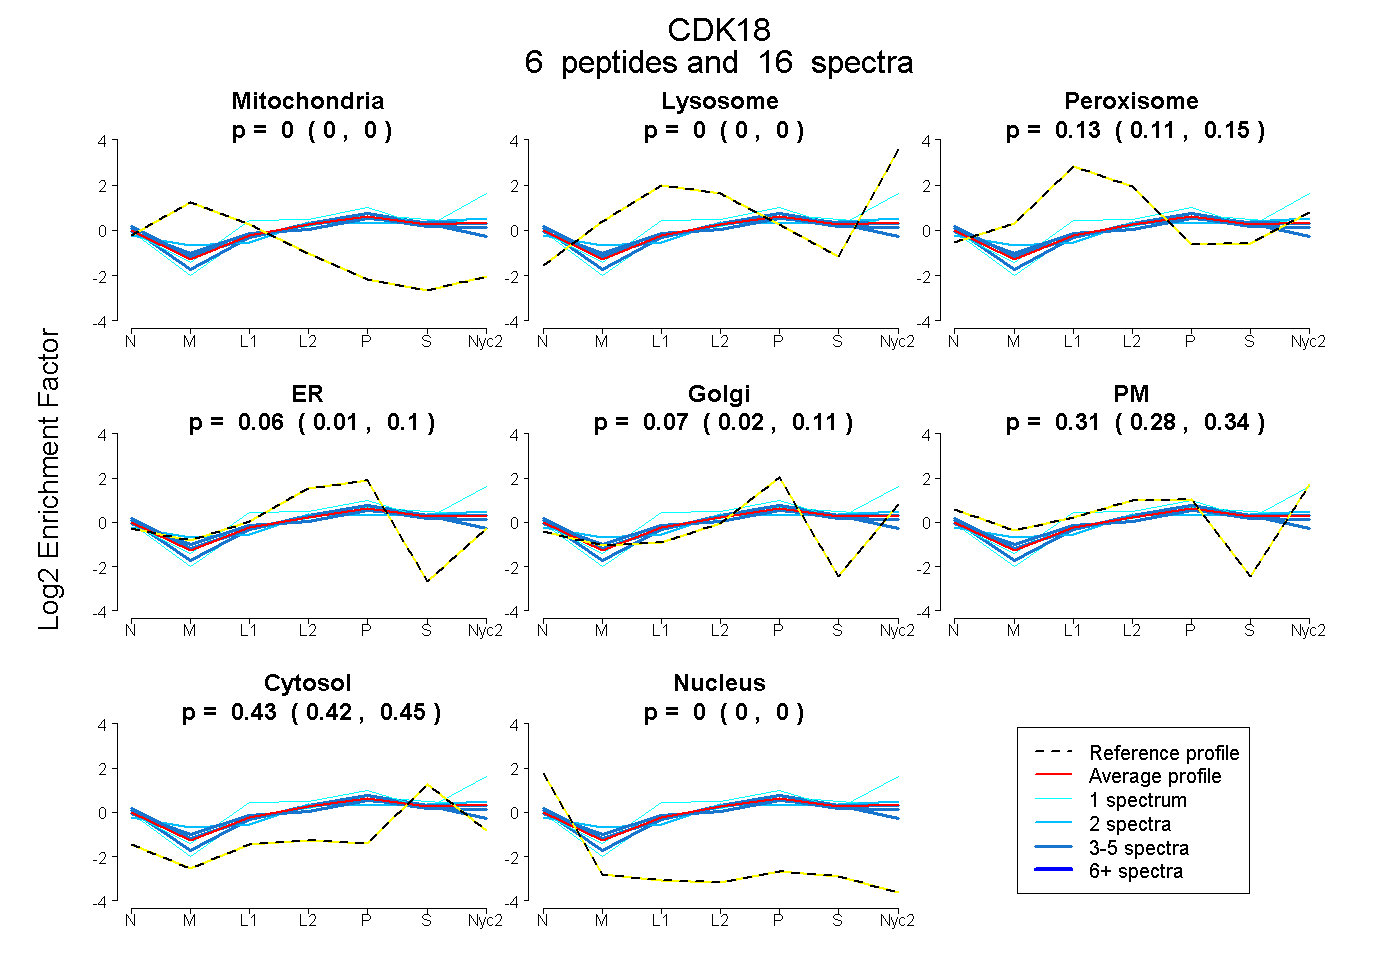
0.000 | 0.000
0.000 | 0.000
0.108 | 0.148
0.007 | 0.097
0.023 | 0.110
0.278 | 0.342
0.417 | 0.445
0.000 | 0.000
1peptide
spectrum
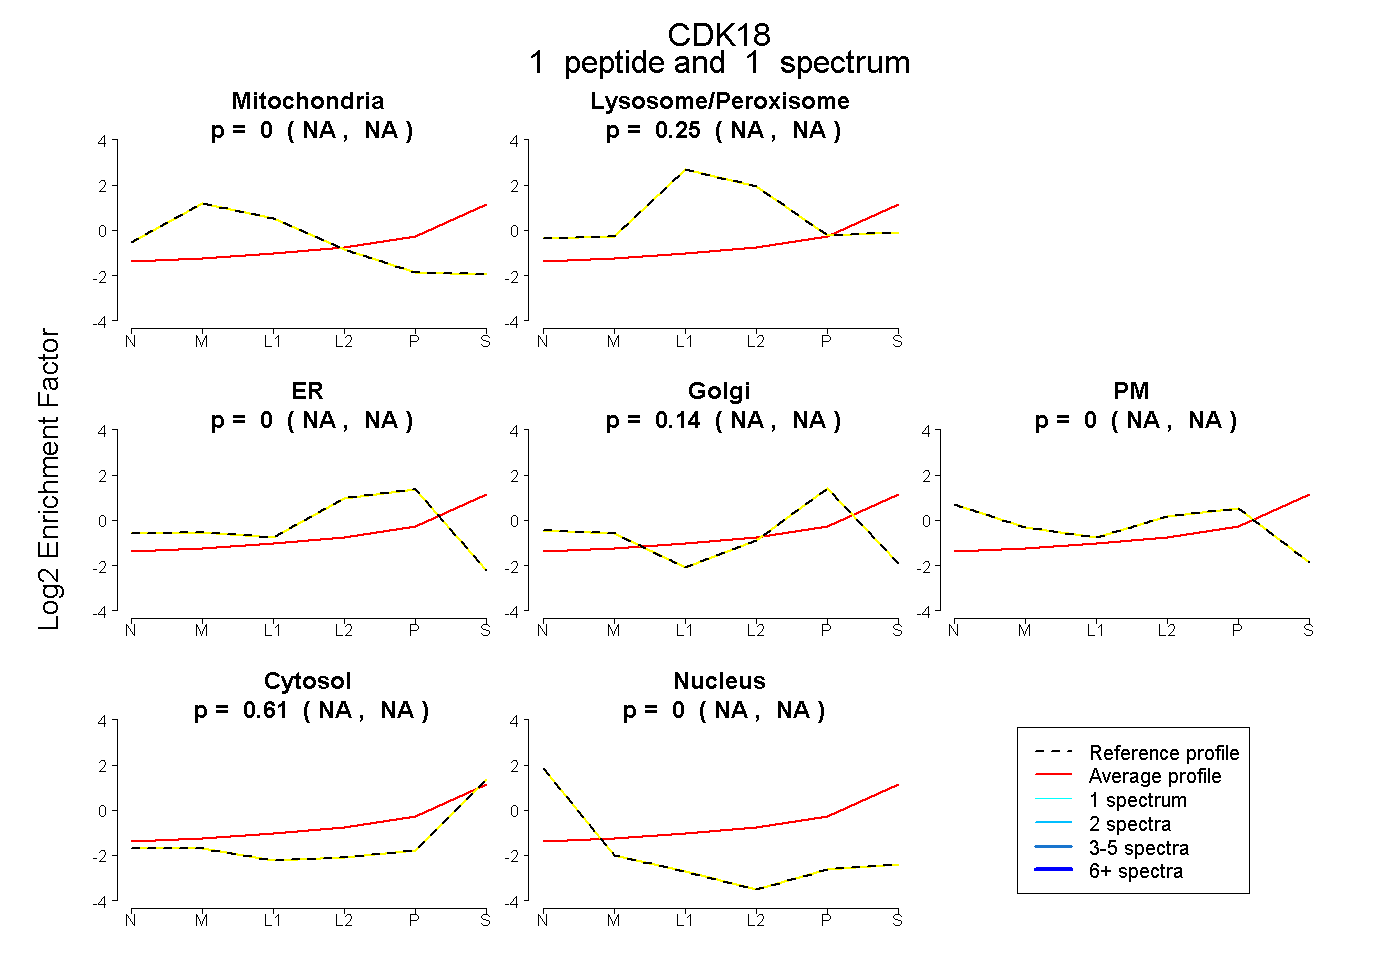
NA | NA
NA | NA
NA | NA
NA | NA
NA | NA
NA | NA
NA | NA
6peptides
spectra
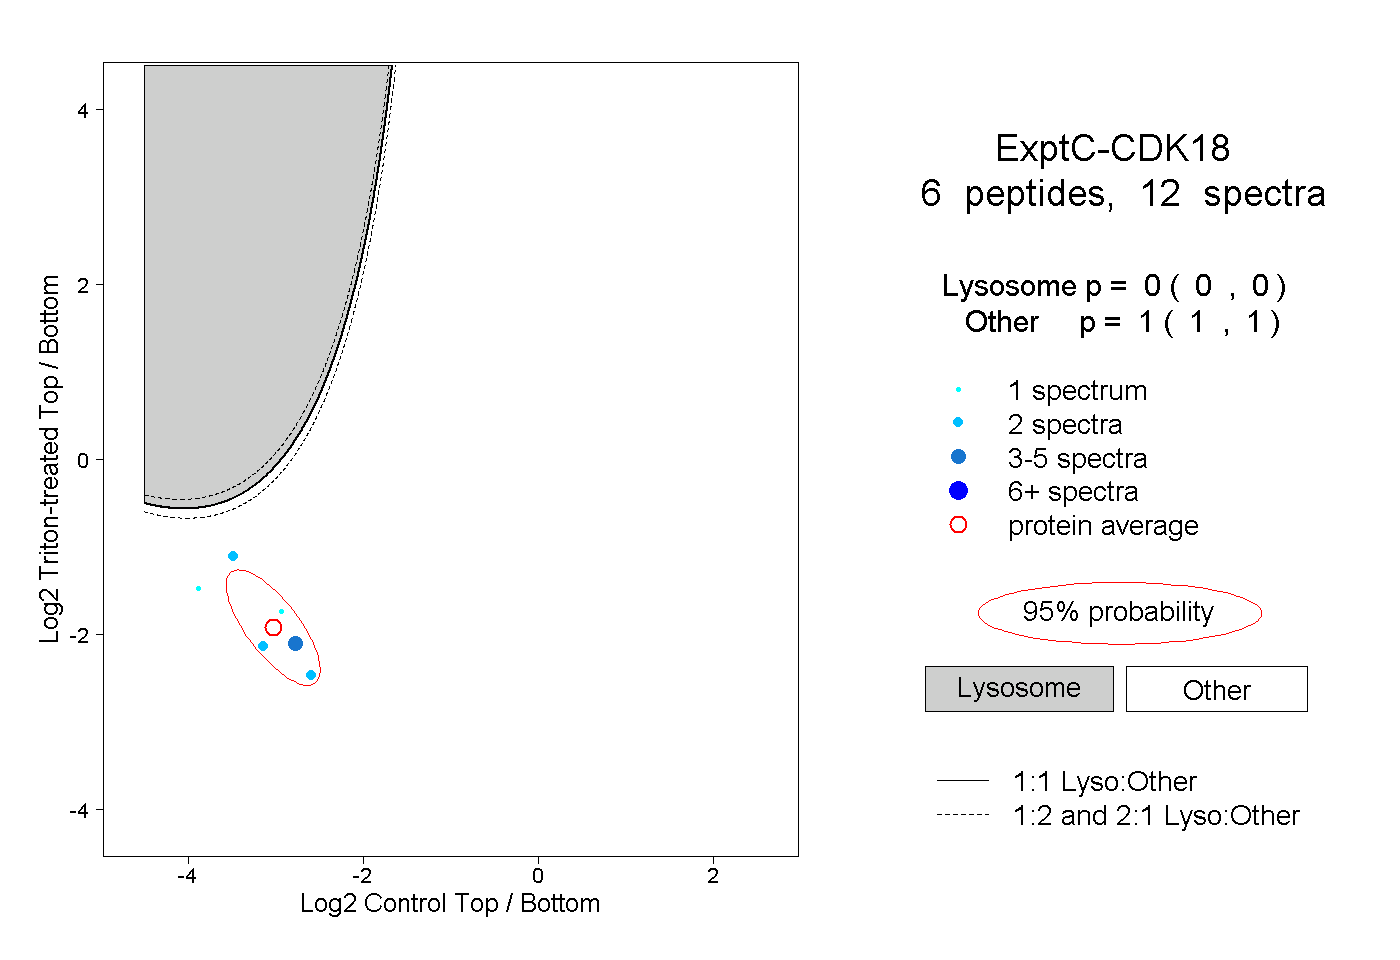
0.000 | 0.000
1.000 | 1.000