 16
16peptides
spectra
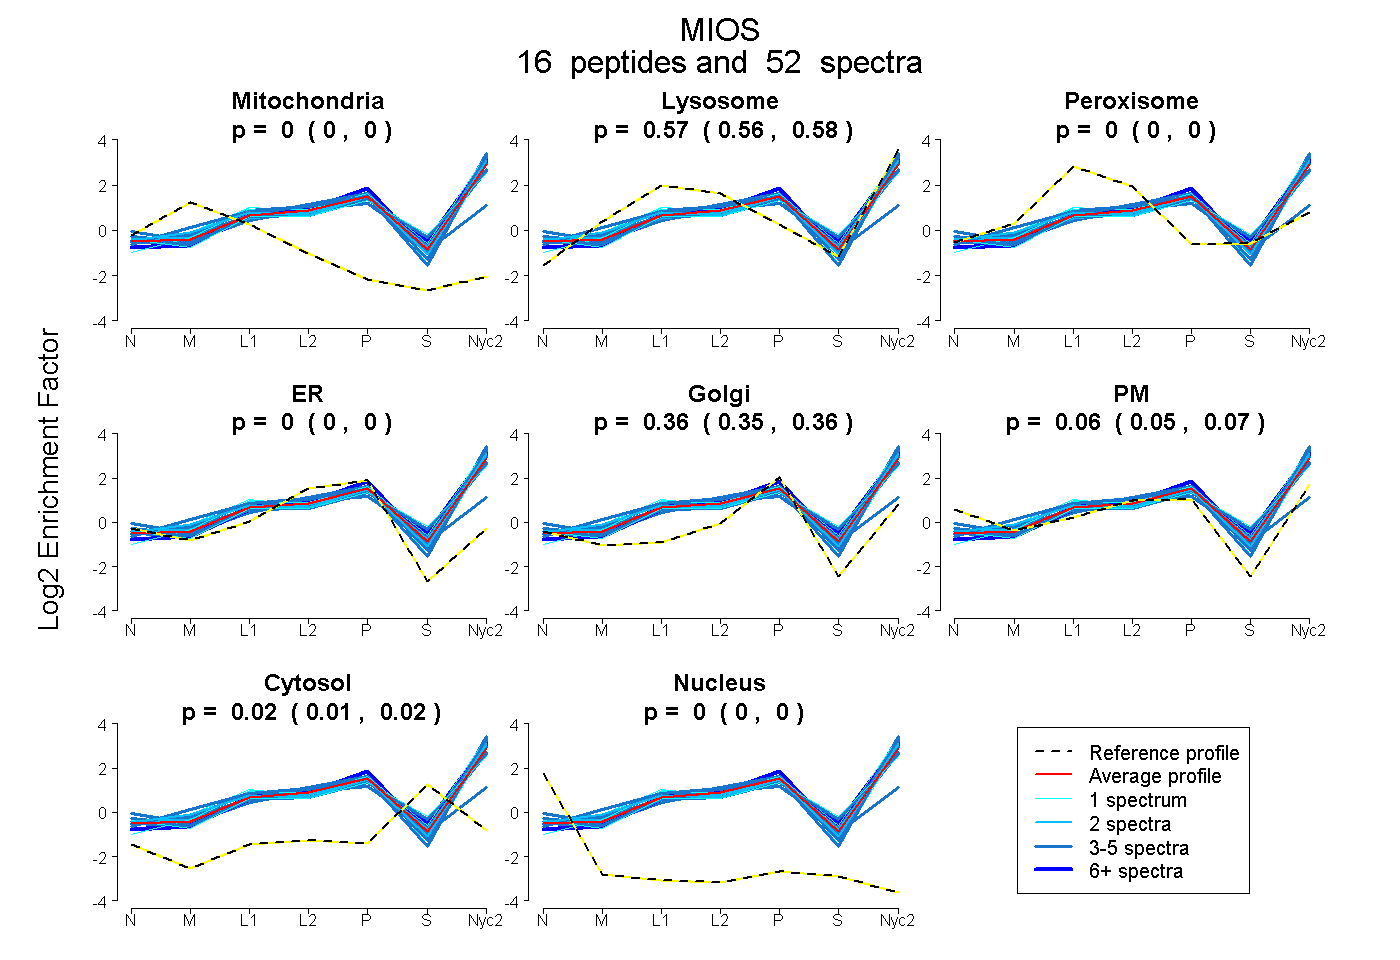
0.000 | 0.000
0.562 | 0.575
0.000 | 0.000
0.000 | 0.000
0.349 | 0.365
0.046 | 0.067
0.011 | 0.018
0.000 | 0.000
8peptides
spectra
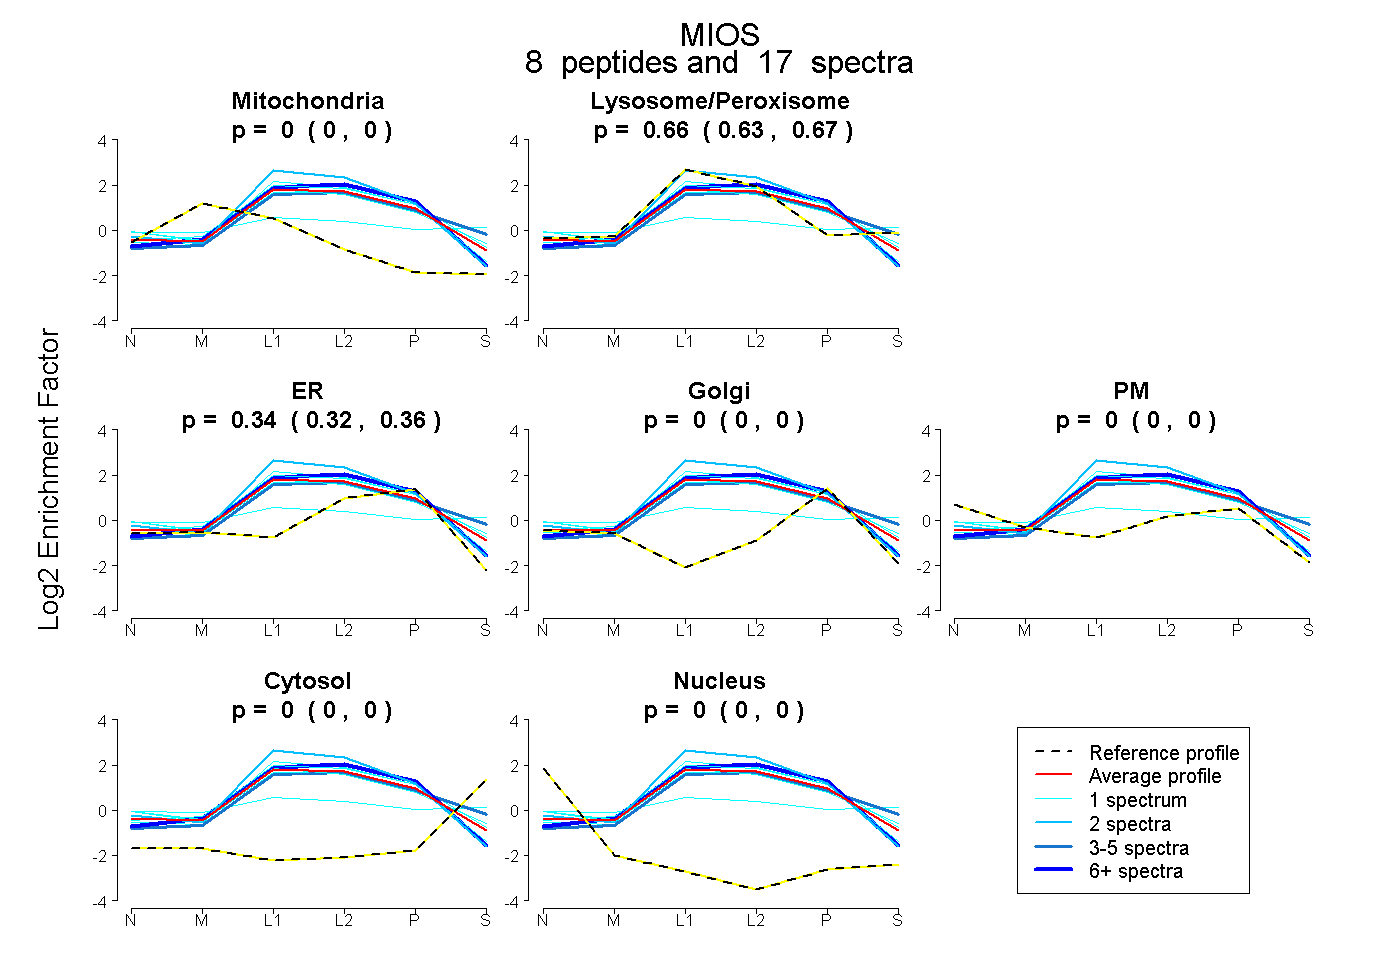
0.000 | 0.000
0.633 | 0.674
0.321 | 0.362
0.000 | 0.000
0.000 | 0.000
0.000 | 0.000
0.000 | 0.000
23peptides
spectra
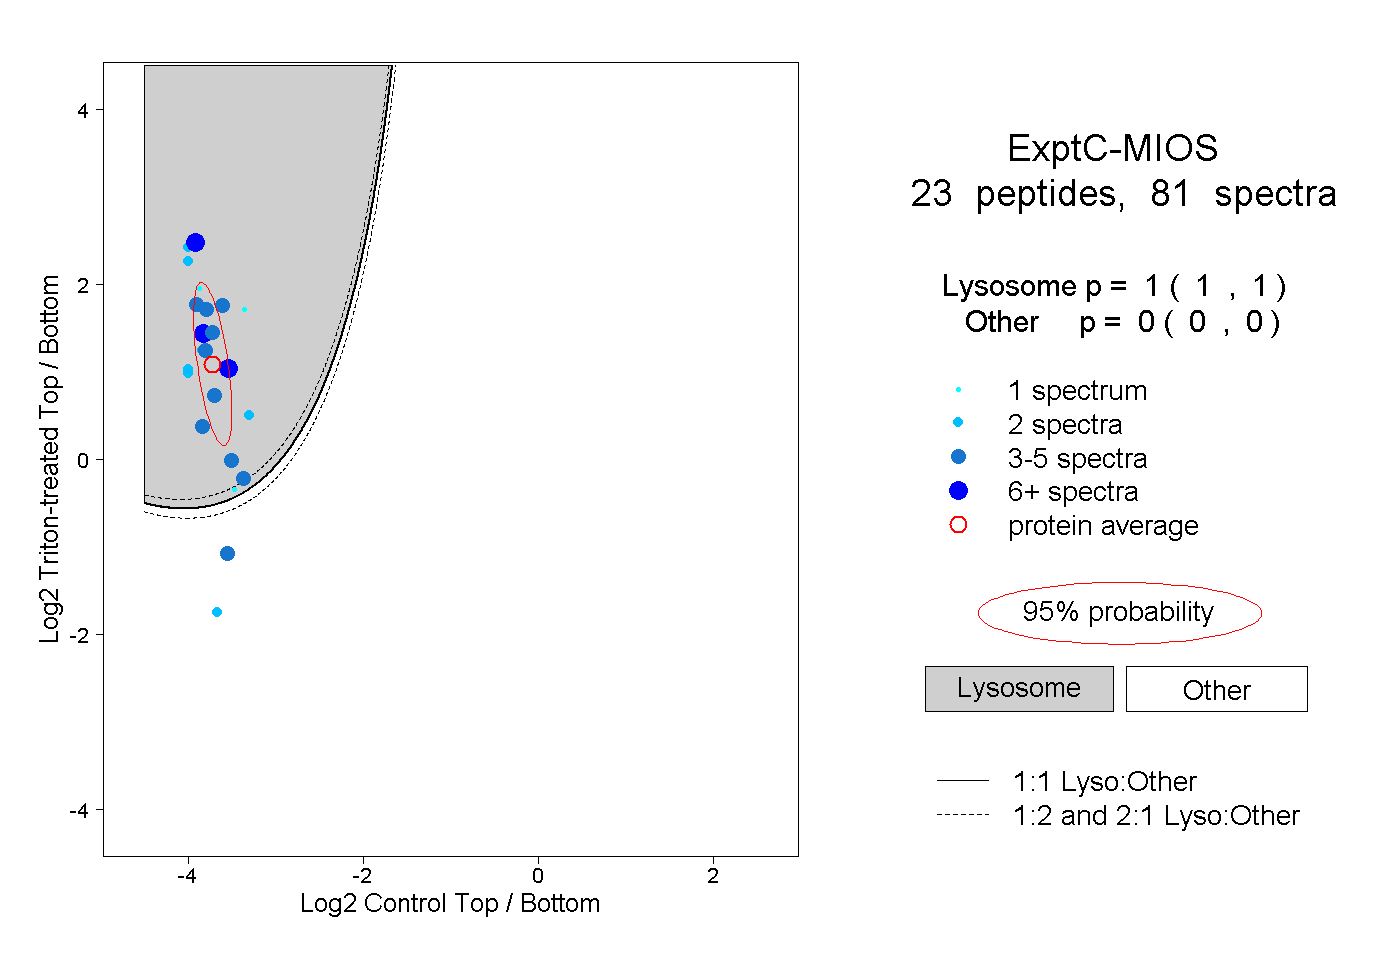
1.000 | 1.000
0.000 | 0.000
5peptides
spectra
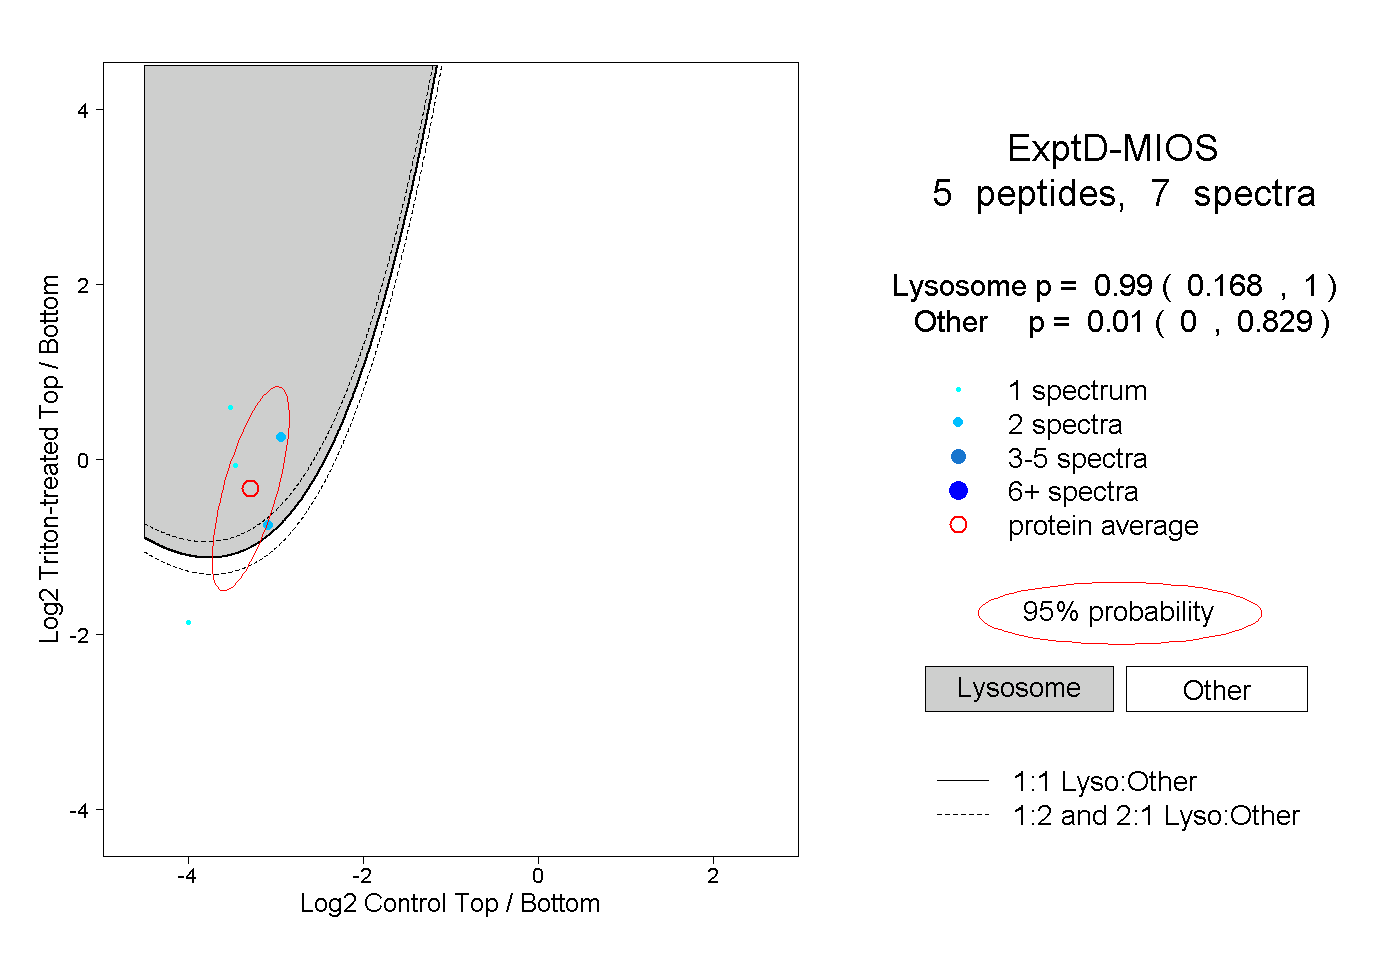
0.168 | 1.000
0.000 | 0.829