 37
37peptides
spectra
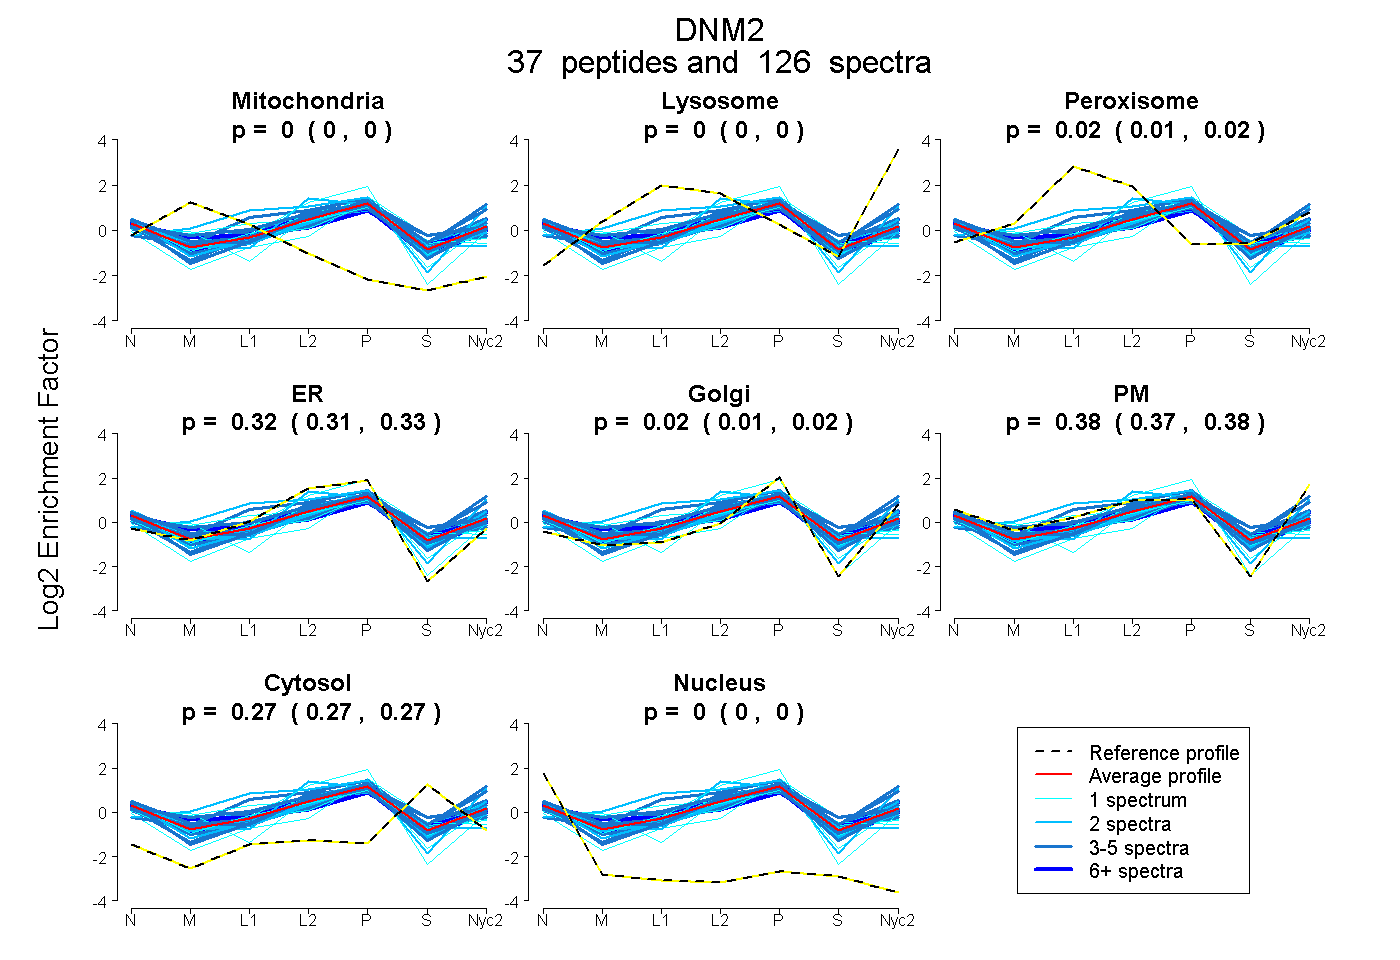
0.000 | 0.000
0.000 | 0.000
0.012 | 0.018
0.315 | 0.326
0.009 | 0.022
0.374 | 0.384
0.266 | 0.270
0.000 | 0.000
19peptides
spectra
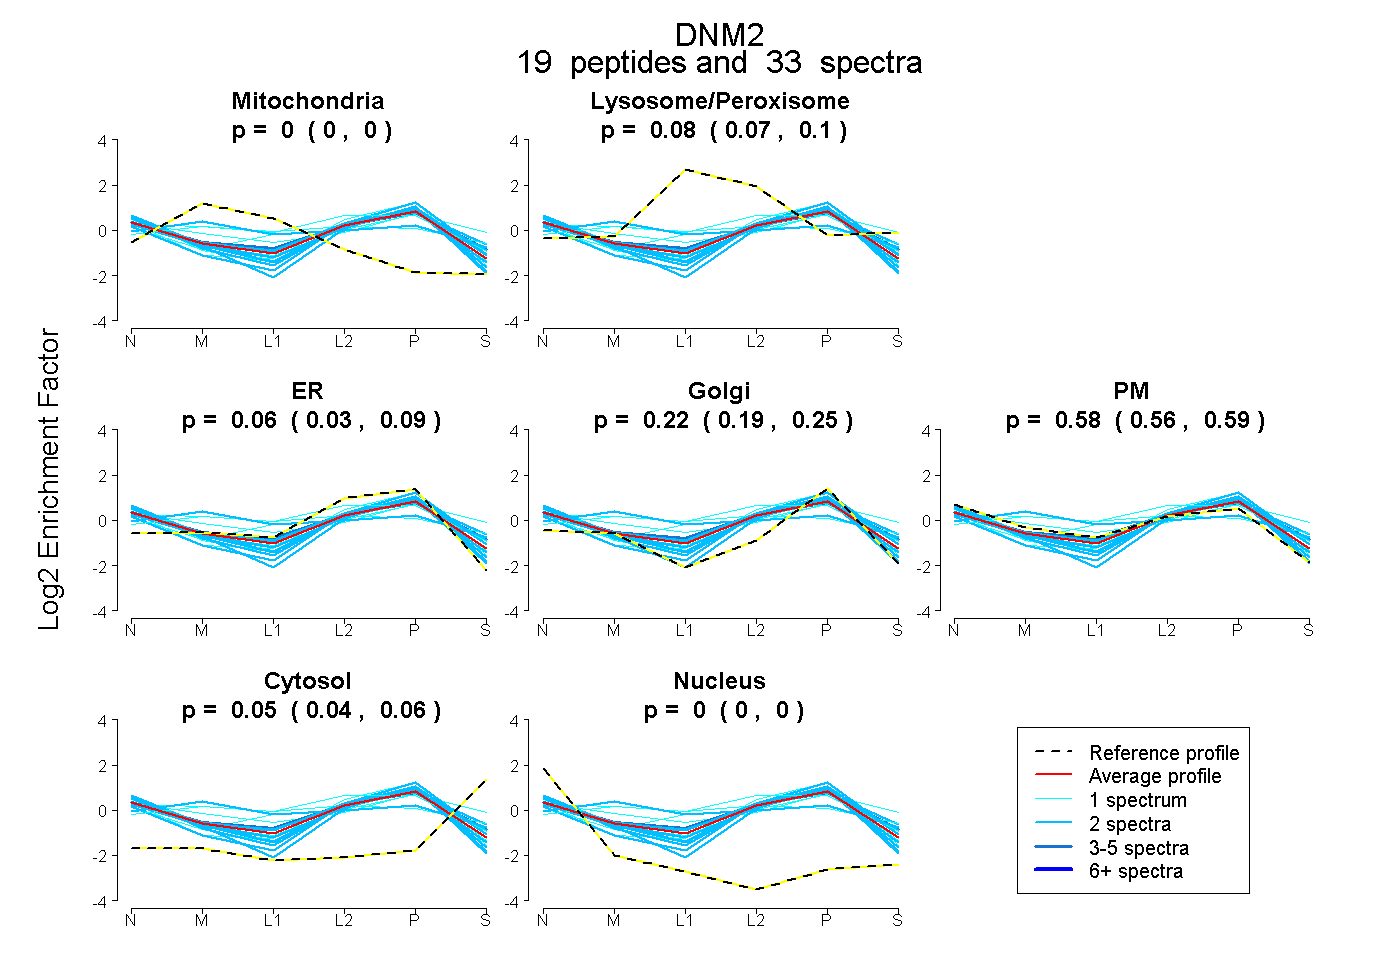
0.000 | 0.000
0.065 | 0.100
0.033 | 0.087
0.192 | 0.250
0.556 | 0.592
0.043 | 0.061
0.000 | 0.000
37peptides
spectra
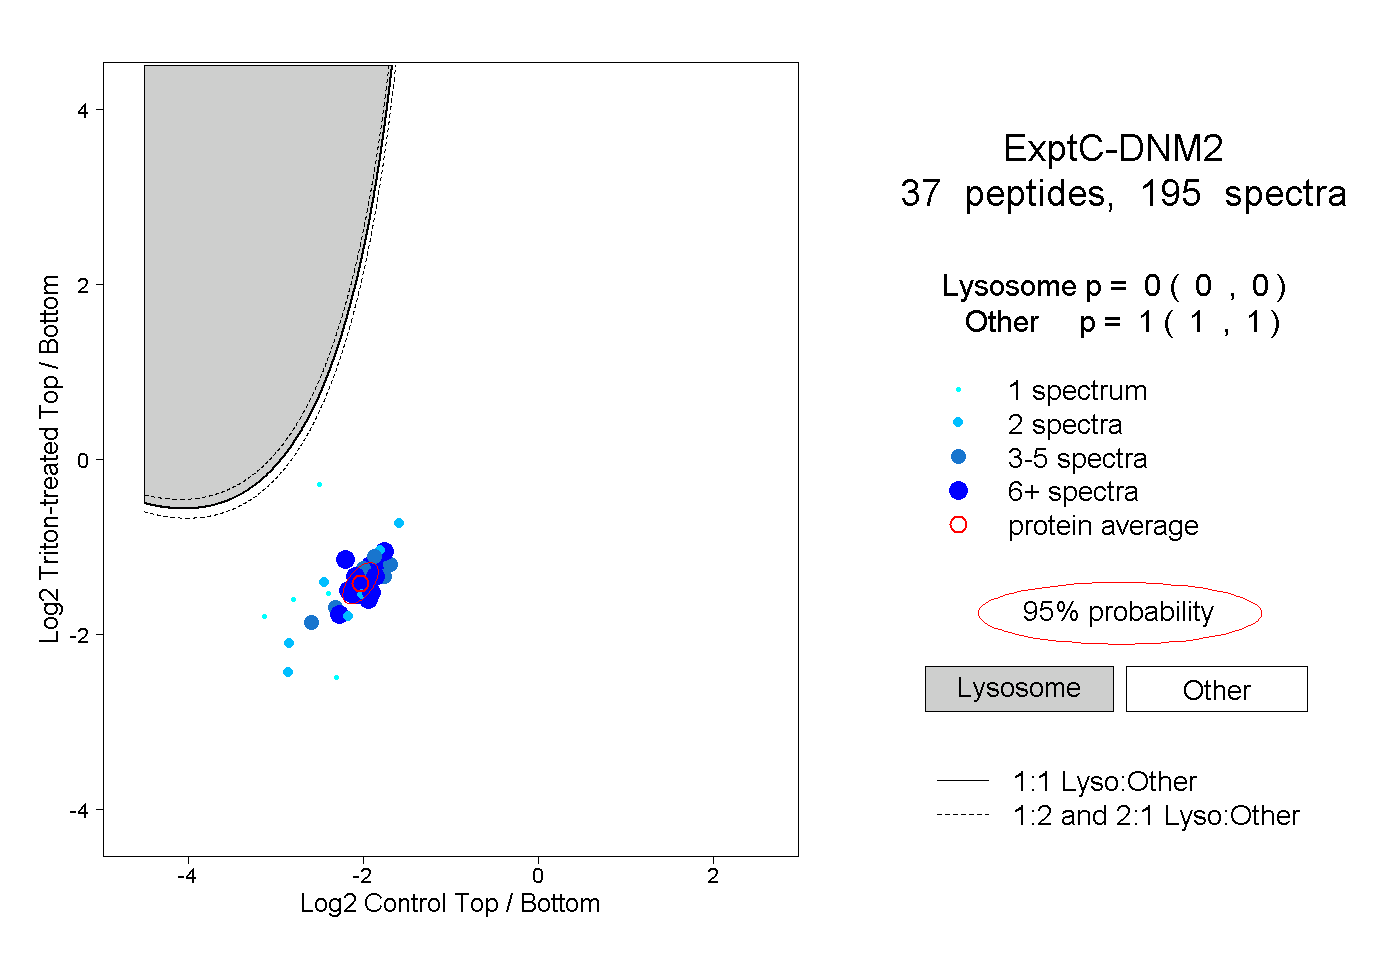
0.000 | 0.000
1.000 | 1.000
13peptides
spectra
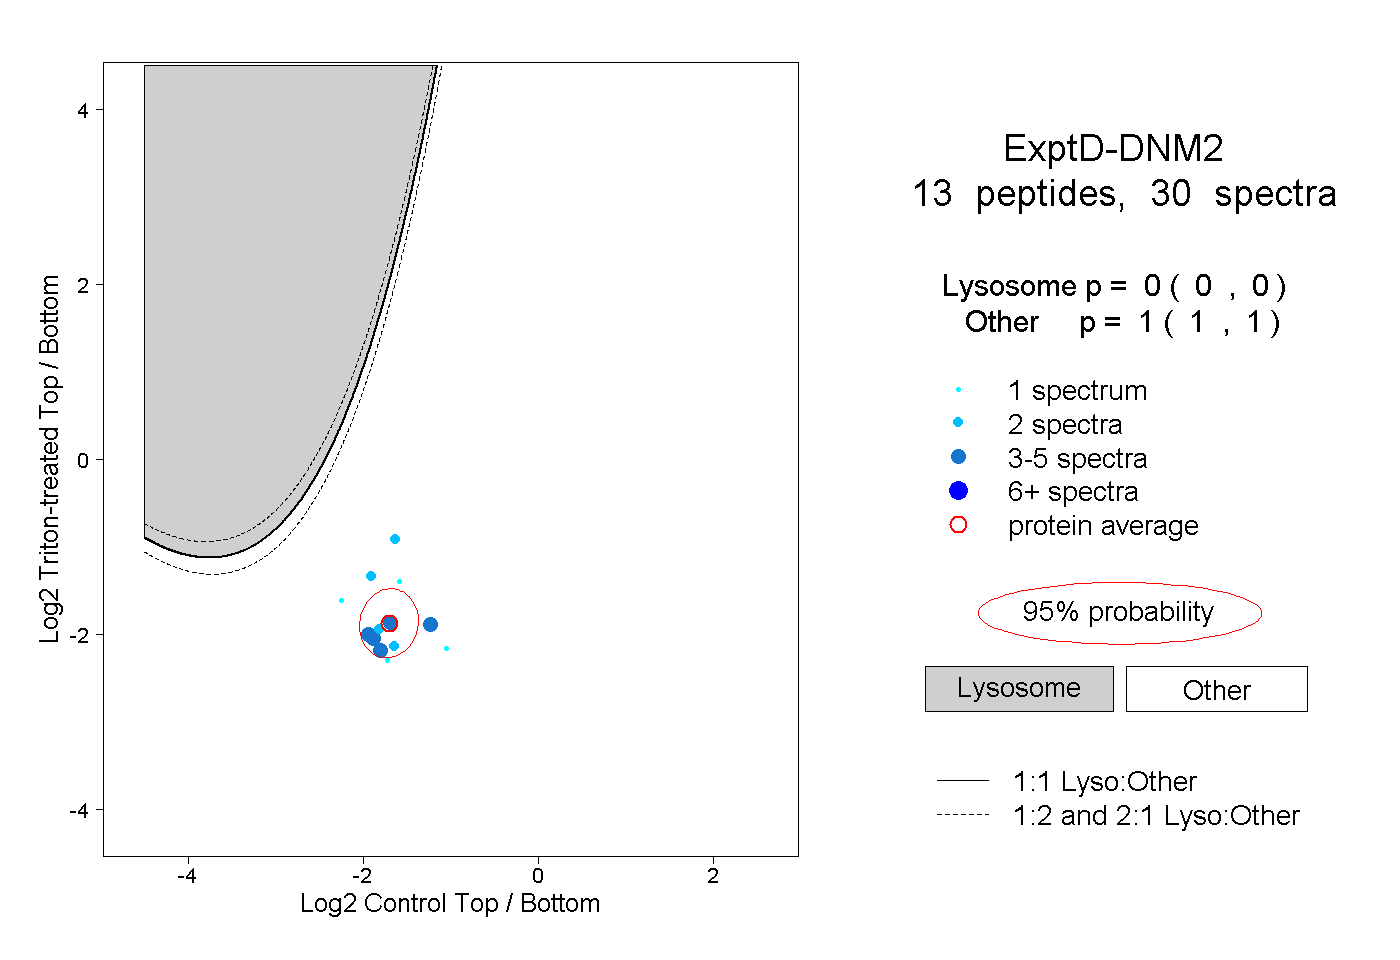
0.000 | 0.000
1.000 | 1.000