 3
3peptides
spectra
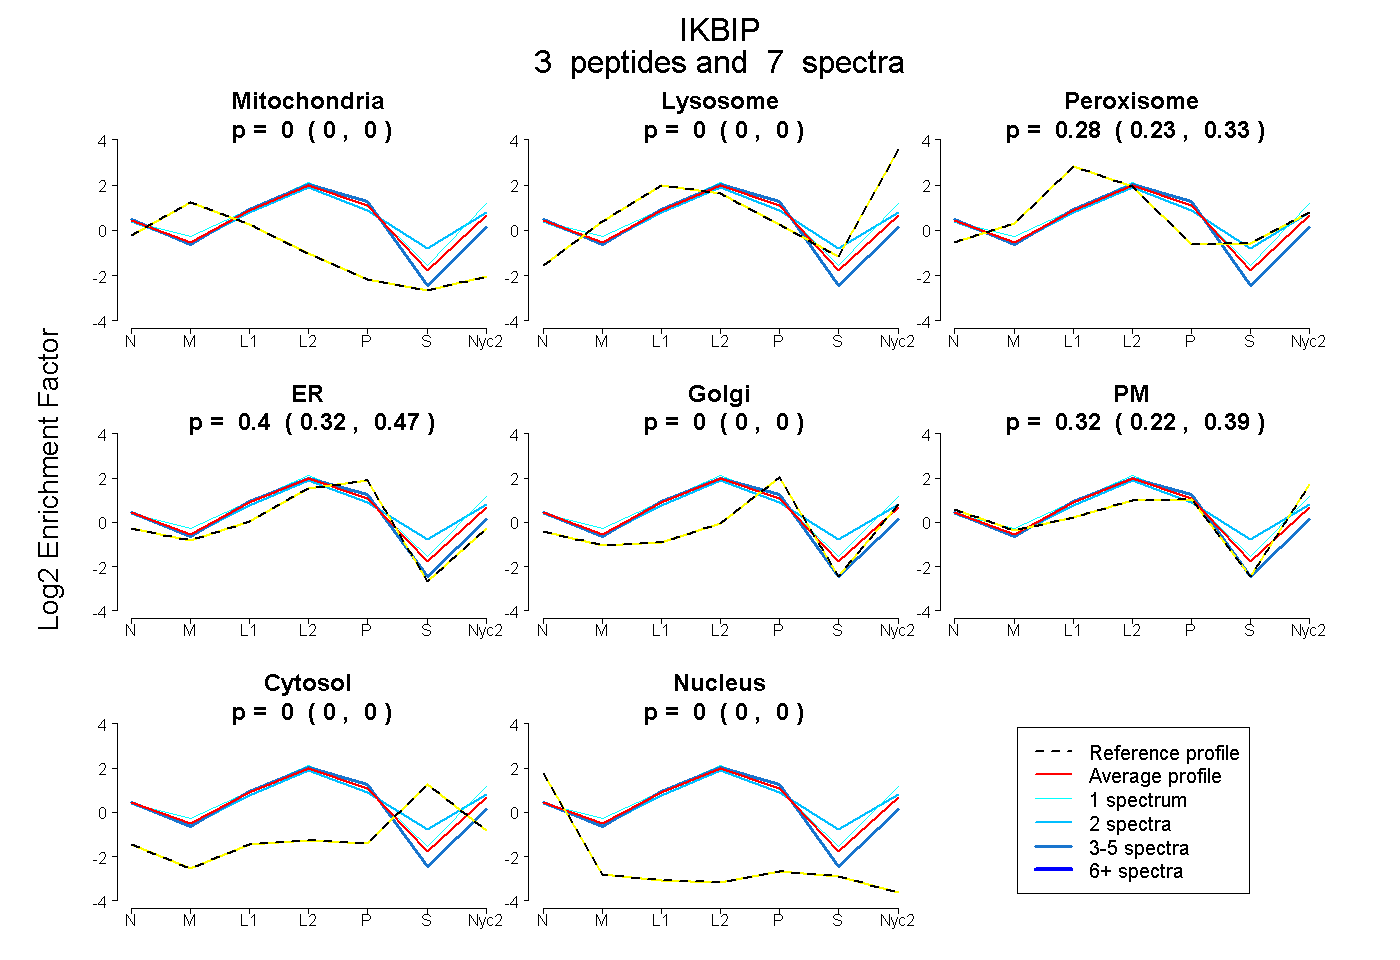
0.000 | 0.000
0.000 | 0.000
0.228 | 0.326
0.324 | 0.470
0.000 | 0.000
0.220 | 0.392
0.000 | 0.000
0.000 | 0.000
1peptide
spectra
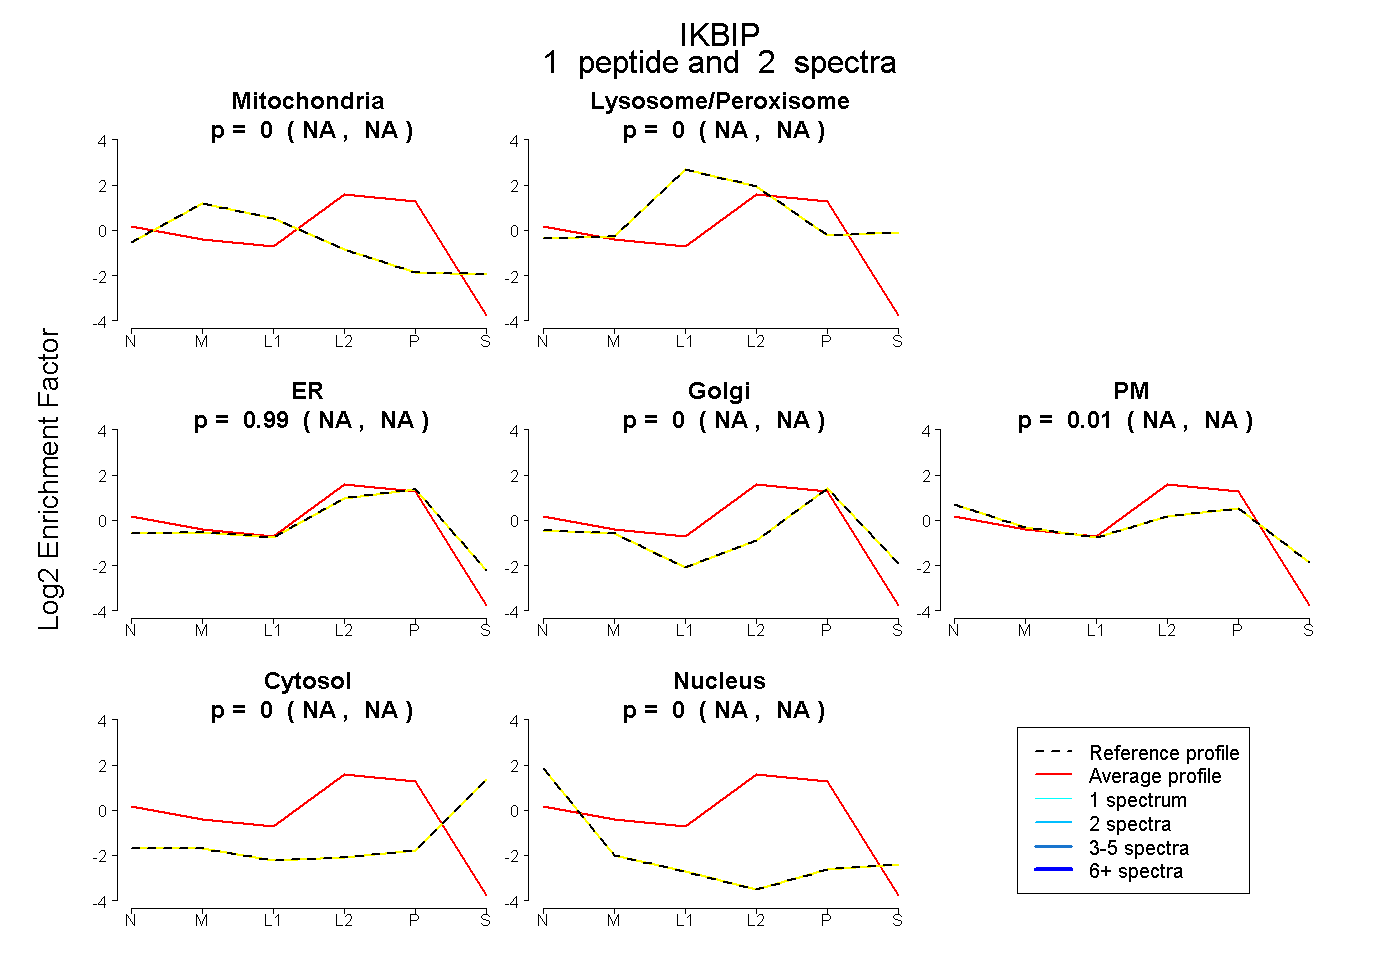
NA | NA
NA | NA
NA | NA
NA | NA
NA | NA
NA | NA
NA | NA
4peptides
spectra
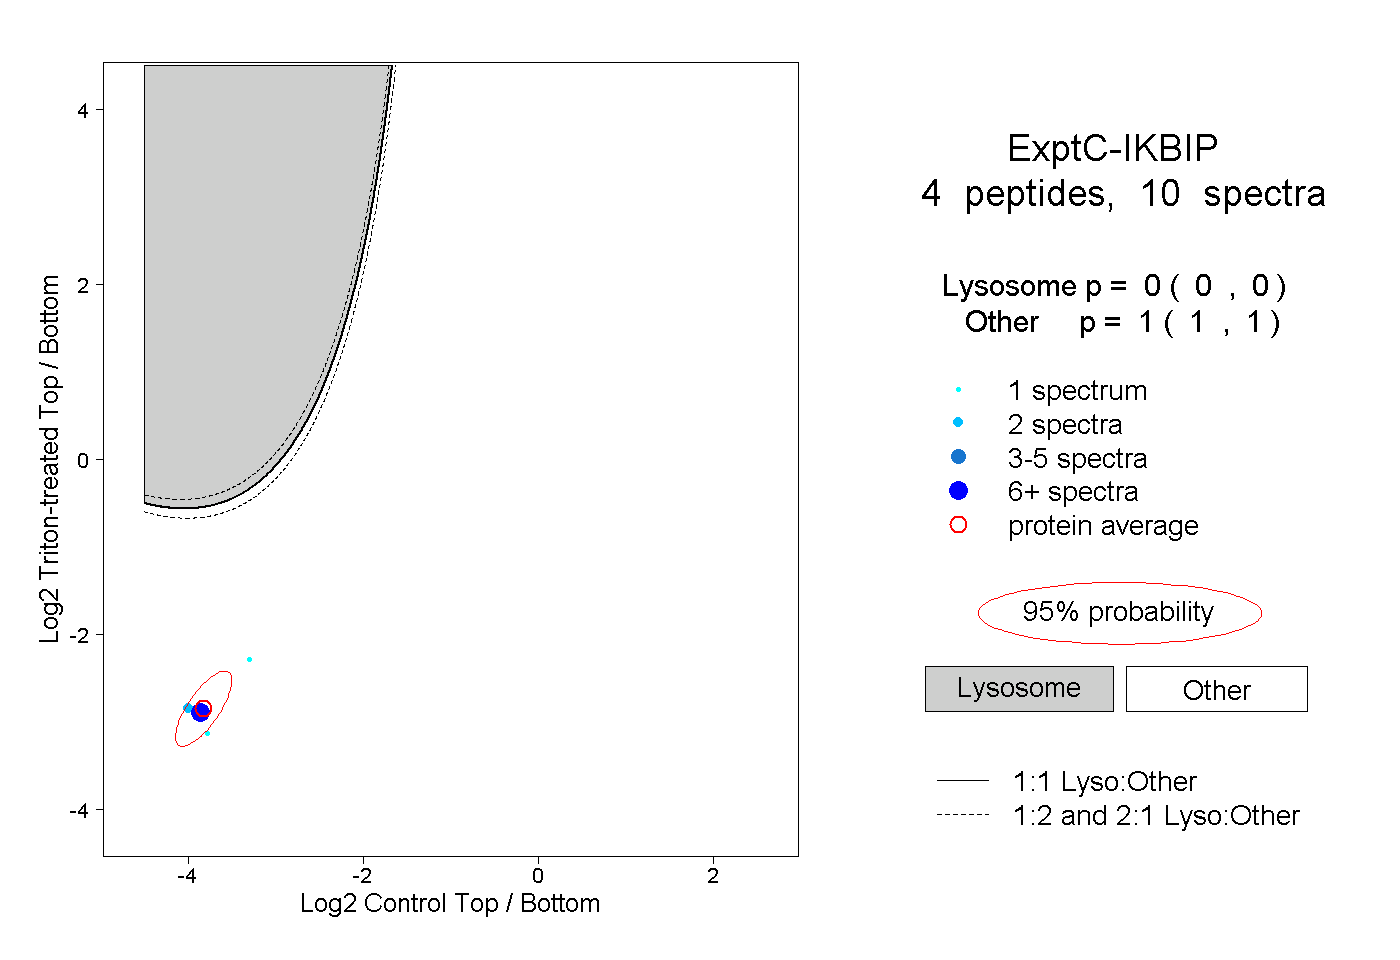
0.000 | 0.000
1.000 | 1.000
1peptide
spectrum
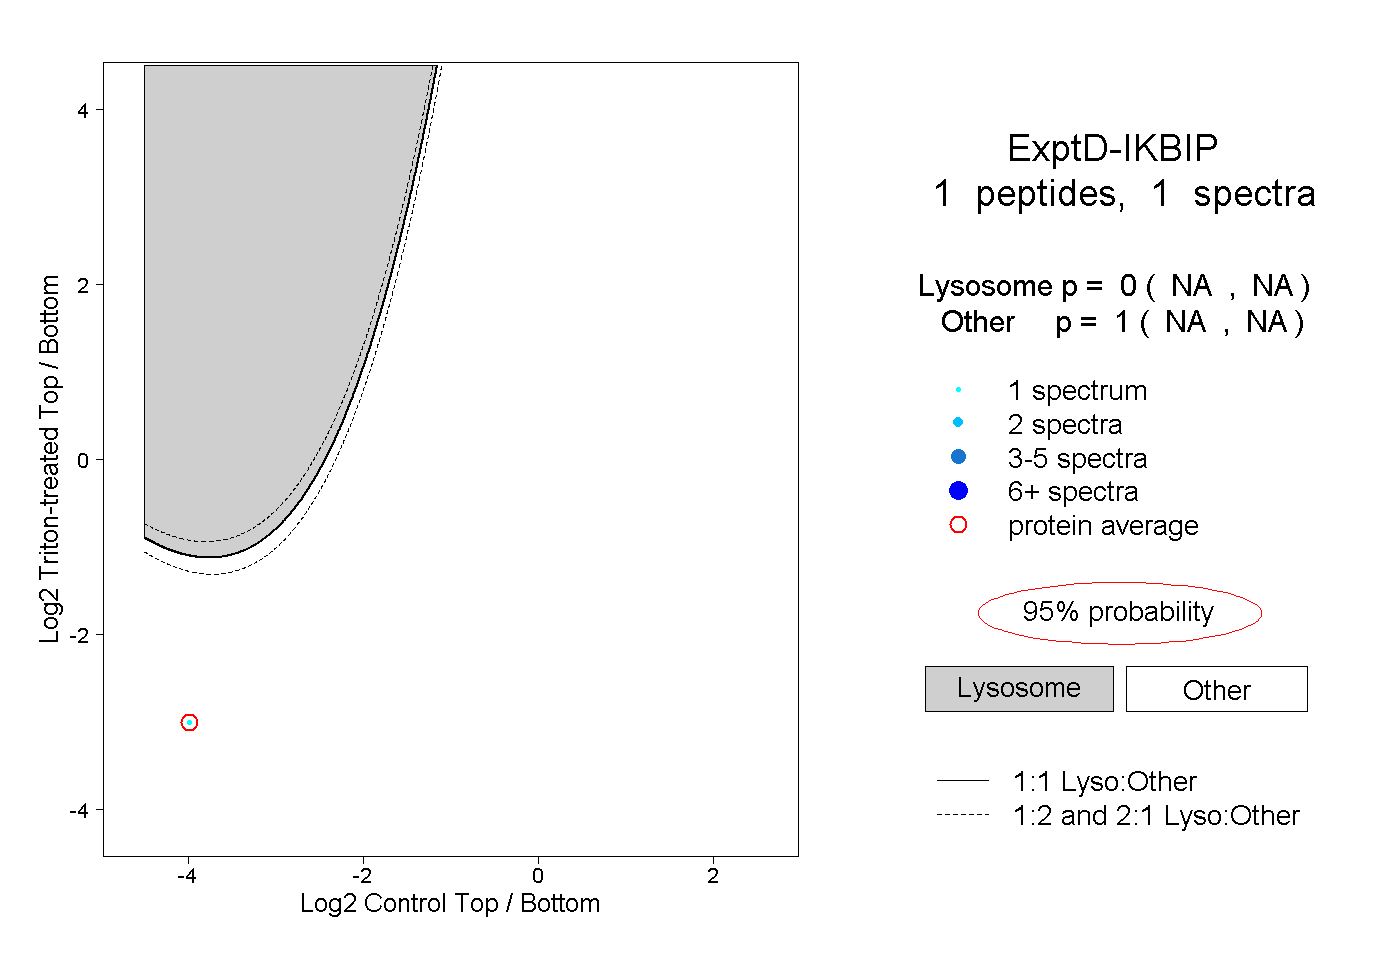
NA | NA
NA | NA