 2
2peptides
spectra
0.000 | 0.000
0.000 | 0.000
0.000 | 0.000
0.250 | 0.500
0.152 | 0.476
0.000 | 0.148
0.105 | 0.206
0.030 | 0.119
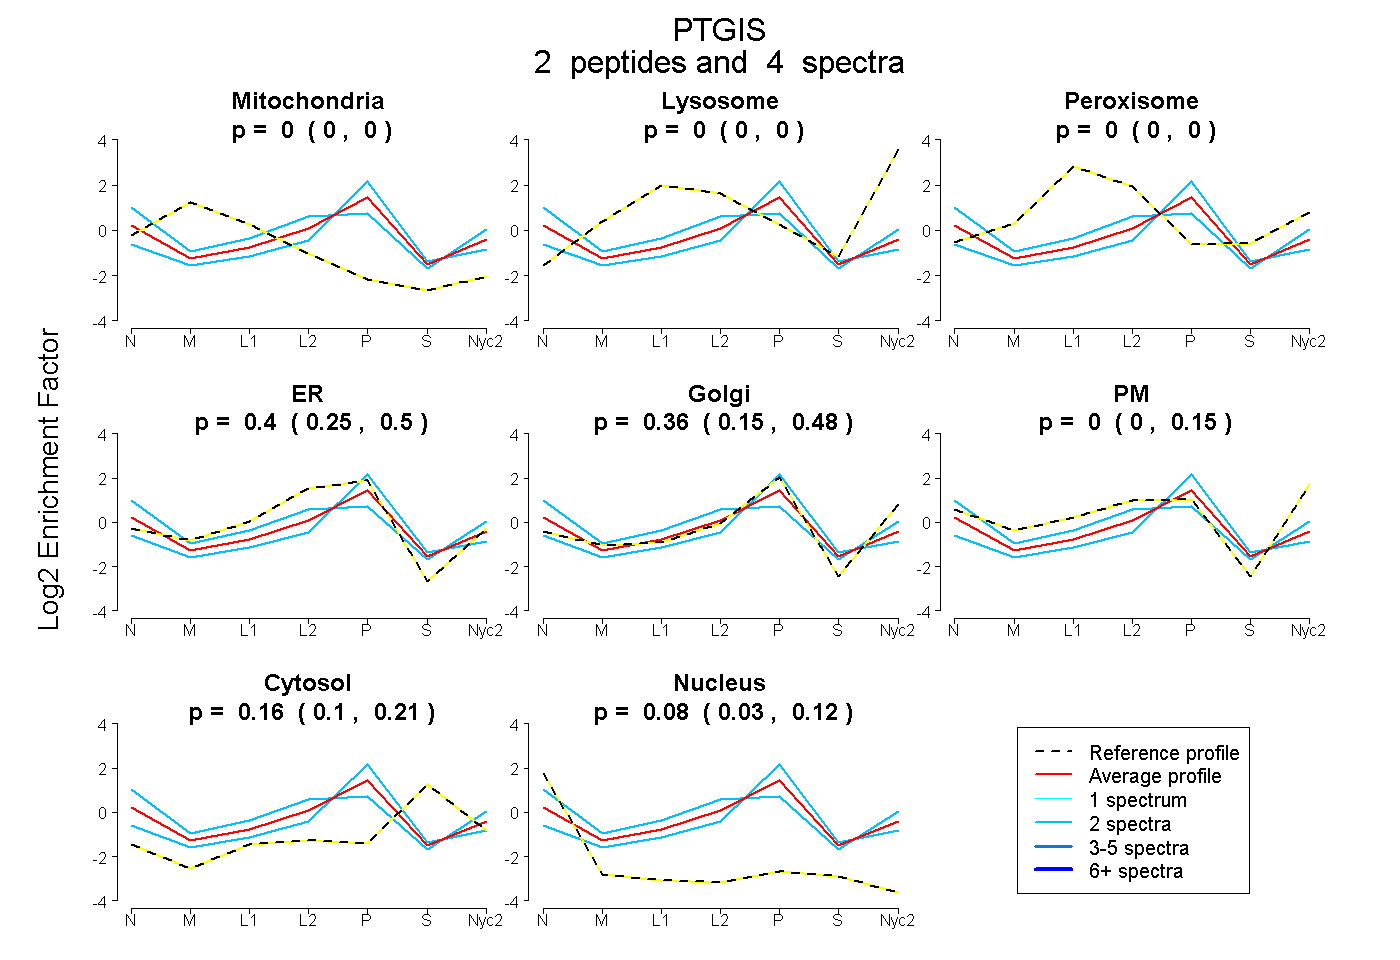
| Plot | Mito | Lyso | Perox | ER | Golgi | PM | Cytosol | Nucleus | |||||
| Expt A |
2 peptides |
4 spectra |
|
0.000 0.000 | 0.000 |
0.000 0.000 | 0.000 |
0.000 0.000 | 0.000 |
0.402 0.250 | 0.500 |
0.360 0.152 | 0.476 |
0.000 0.000 | 0.148 |
0.161 0.105 | 0.206 |
0.077 0.030 | 0.119 |