12
12peptides
spectra
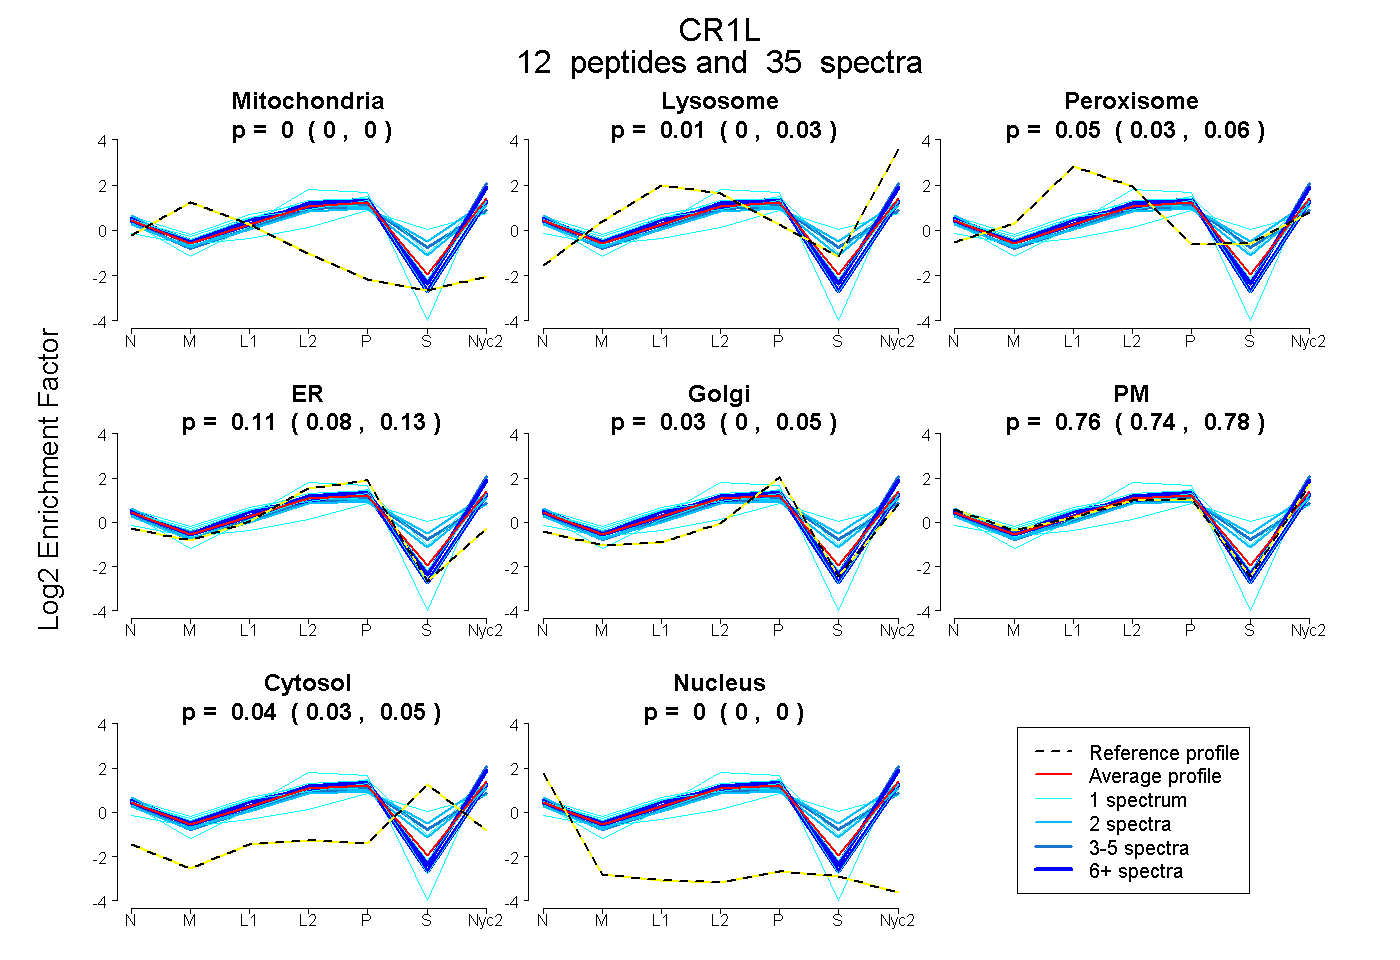
0.000 | 0.000
0.000 | 0.027
0.028 | 0.064
0.084 | 0.131
0.000 | 0.051
0.744 | 0.779
0.030 | 0.047
0.000 | 0.000
3peptides
spectra
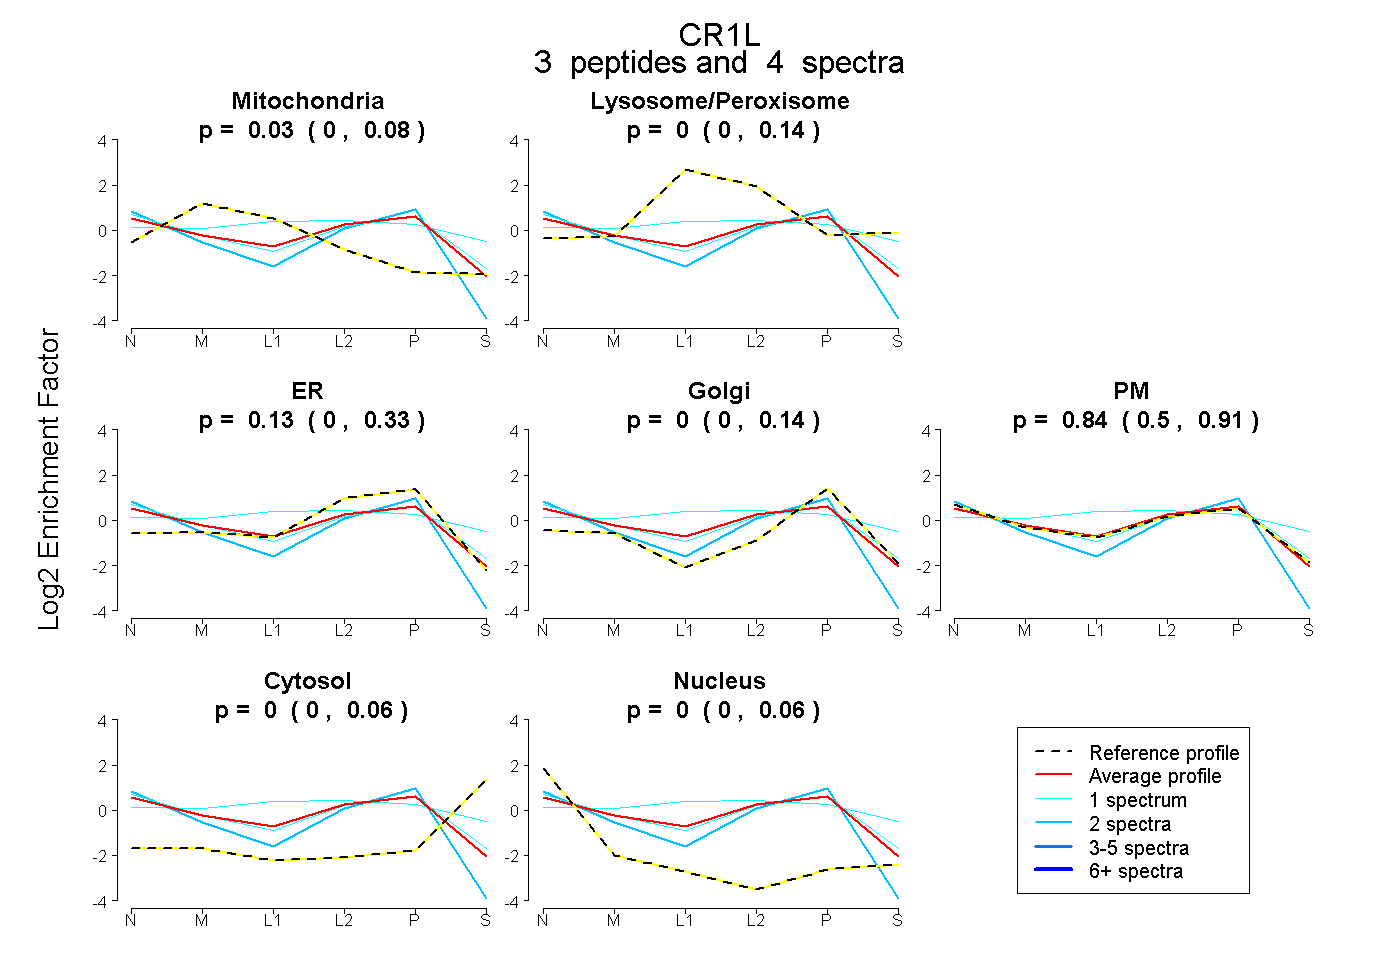
0.000 | 0.084
0.000 | 0.144
0.000 | 0.333
0.000 | 0.144
0.502 | 0.915
0.000 | 0.058
0.000 | 0.060
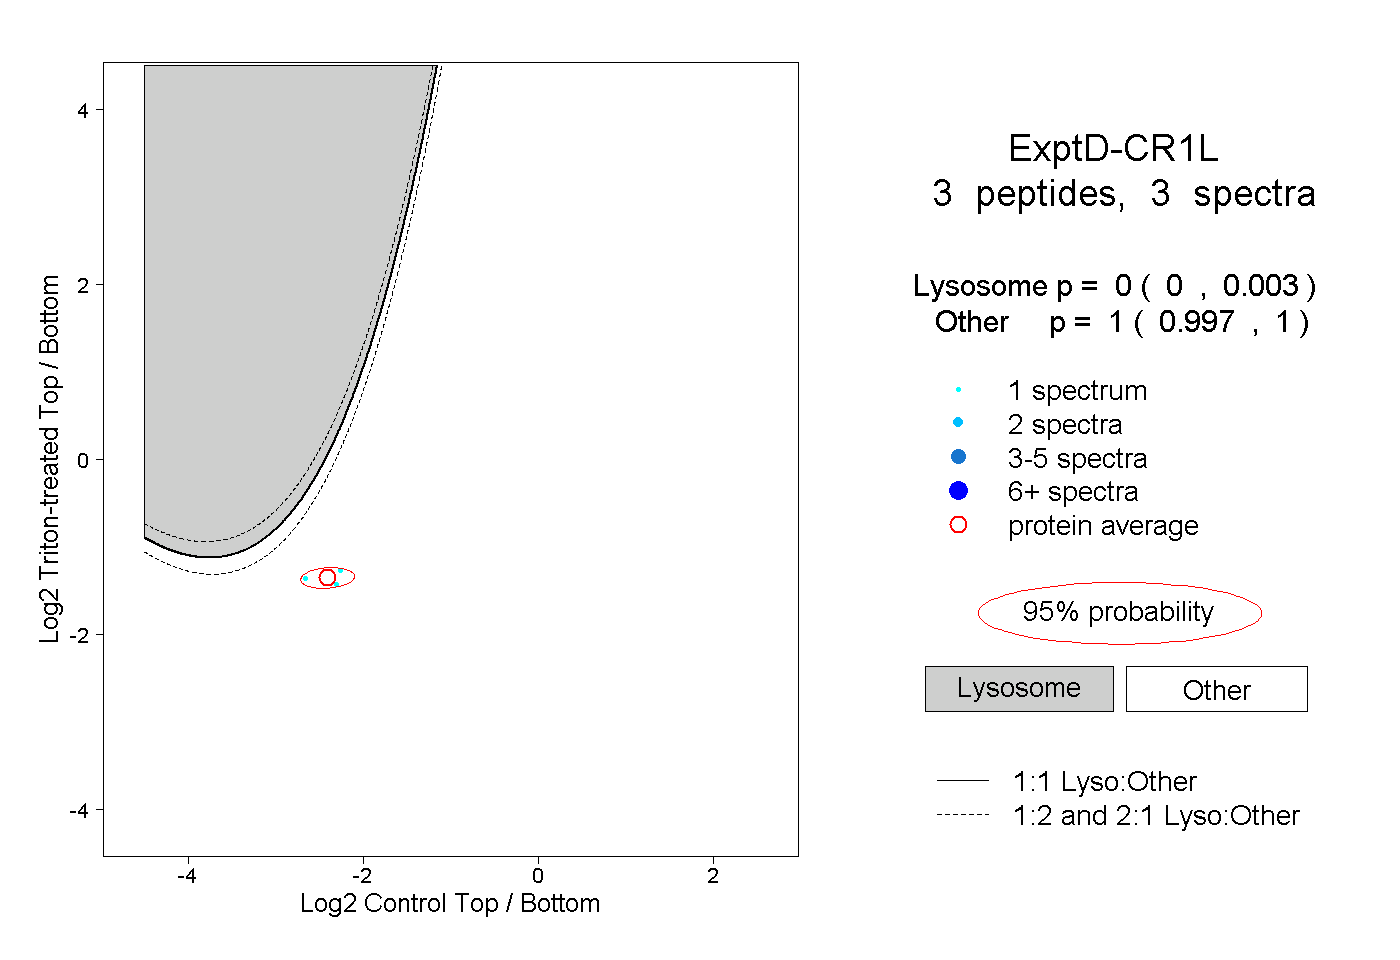
11peptides
spectra
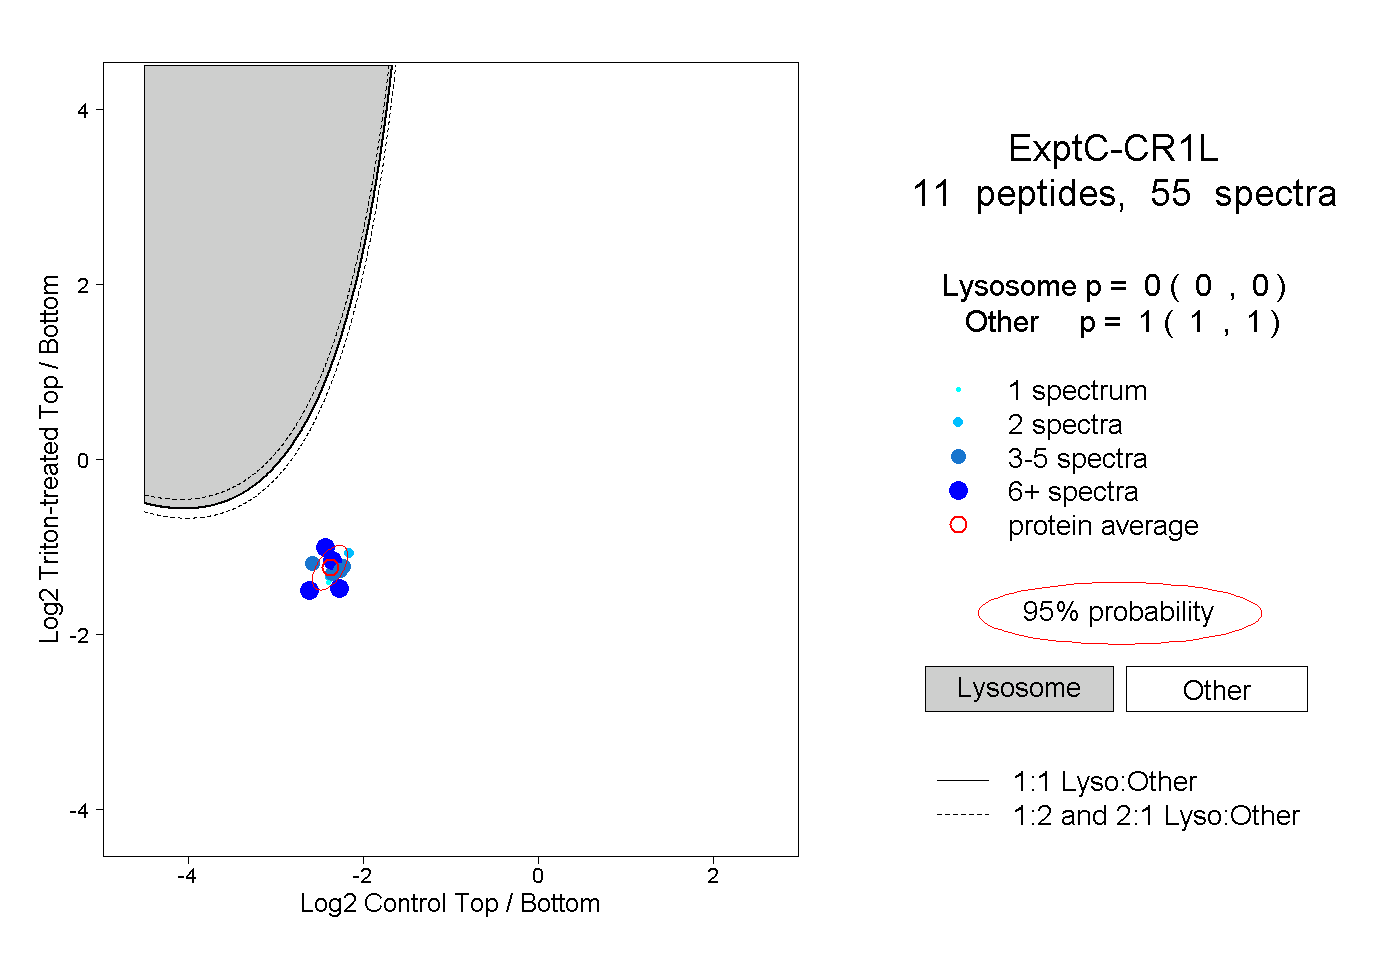
0.000 | 0.000
1.000 | 1.000