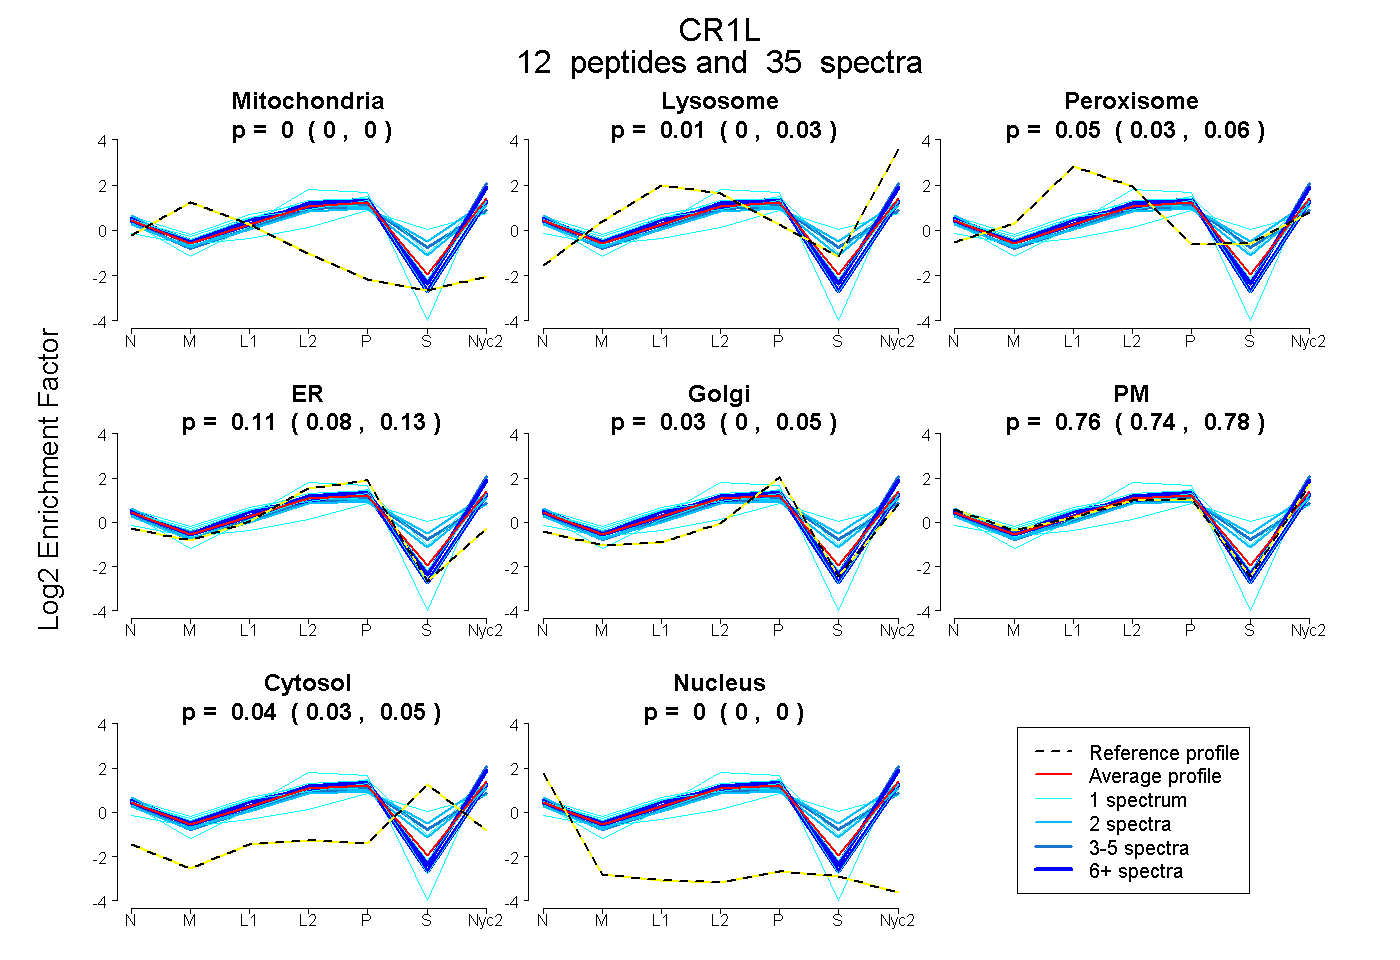
 12
12peptides
spectra
0.000 | 0.000
0.000 | 0.027
0.028 | 0.064
0.084 | 0.131
0.000 | 0.051
0.744 | 0.779
0.030 | 0.047
0.000 | 0.000
| Plot | Mito | Lyso | Perox | ER | Golgi | PM | Cytosol | Nucleus | |||||
| Expt A |
12 peptides |
35 spectra |
|
0.000 0.000 | 0.000 |
0.015 0.000 | 0.027 |
0.047 0.028 | 0.064 |
0.111 0.084 | 0.131 |
0.025 0.000 | 0.051 |
0.763 0.744 | 0.779 |
0.039 0.030 | 0.047 |
0.000 0.000 | 0.000 |
| 2 spectra, QCETPLDPQNGIVHVNTDIR | 0.000 | 0.072 | 0.140 | 0.056 | 0.000 | 0.539 | 0.194 | 0.000 | ||
| 6 spectra, GDSSVYCR | 0.000 | 0.000 | 0.003 | 0.205 | 0.000 | 0.792 | 0.000 | 0.000 | ||
| 3 spectra, EDFHYGMVVTYQCNTDAR | 0.000 | 0.000 | 0.121 | 0.139 | 0.000 | 0.542 | 0.198 | 0.000 | ||
| 1 spectrum, EVGIYLNSK | 0.000 | 0.067 | 0.114 | 0.000 | 0.225 | 0.258 | 0.337 | 0.000 | ||
| 5 spectra, DMVEFR | 0.000 | 0.066 | 0.000 | 0.000 | 0.002 | 0.932 | 0.000 | 0.000 | ||
| 2 spectra, NSLTQEV | 0.000 | 0.000 | 0.056 | 0.028 | 0.000 | 0.743 | 0.172 | 0.000 | ||
| 1 spectrum, WEPQLPSCFK | 0.000 | 0.010 | 0.012 | 0.254 | 0.000 | 0.724 | 0.000 | 0.000 | ||
| 11 spectra, SLFSLR | 0.000 | 0.059 | 0.000 | 0.032 | 0.031 | 0.877 | 0.000 | 0.000 | ||
| 1 spectrum, YECRPGYIK | 0.000 | 0.000 | 0.110 | 0.071 | 0.090 | 0.728 | 0.000 | 0.000 | ||
| 1 spectrum, CTPPHVENAVIVSK | 0.000 | 0.000 | 0.000 | 0.168 | 0.000 | 0.832 | 0.000 | 0.000 | ||
| 1 spectrum, LPQDMSGFQK | 0.000 | 0.095 | 0.000 | 0.138 | 0.044 | 0.577 | 0.146 | 0.000 | ||
| 1 spectrum, FGSSITYTCNEGYR | 0.000 | 0.000 | 0.139 | 0.057 | 0.000 | 0.805 | 0.000 | 0.000 |
| Plot | Mito | Lyso or Perox | ER | Golgi | PM | Cytosol | Nucleus | ||||||
| Expt B |
3 peptides |
4 spectra |
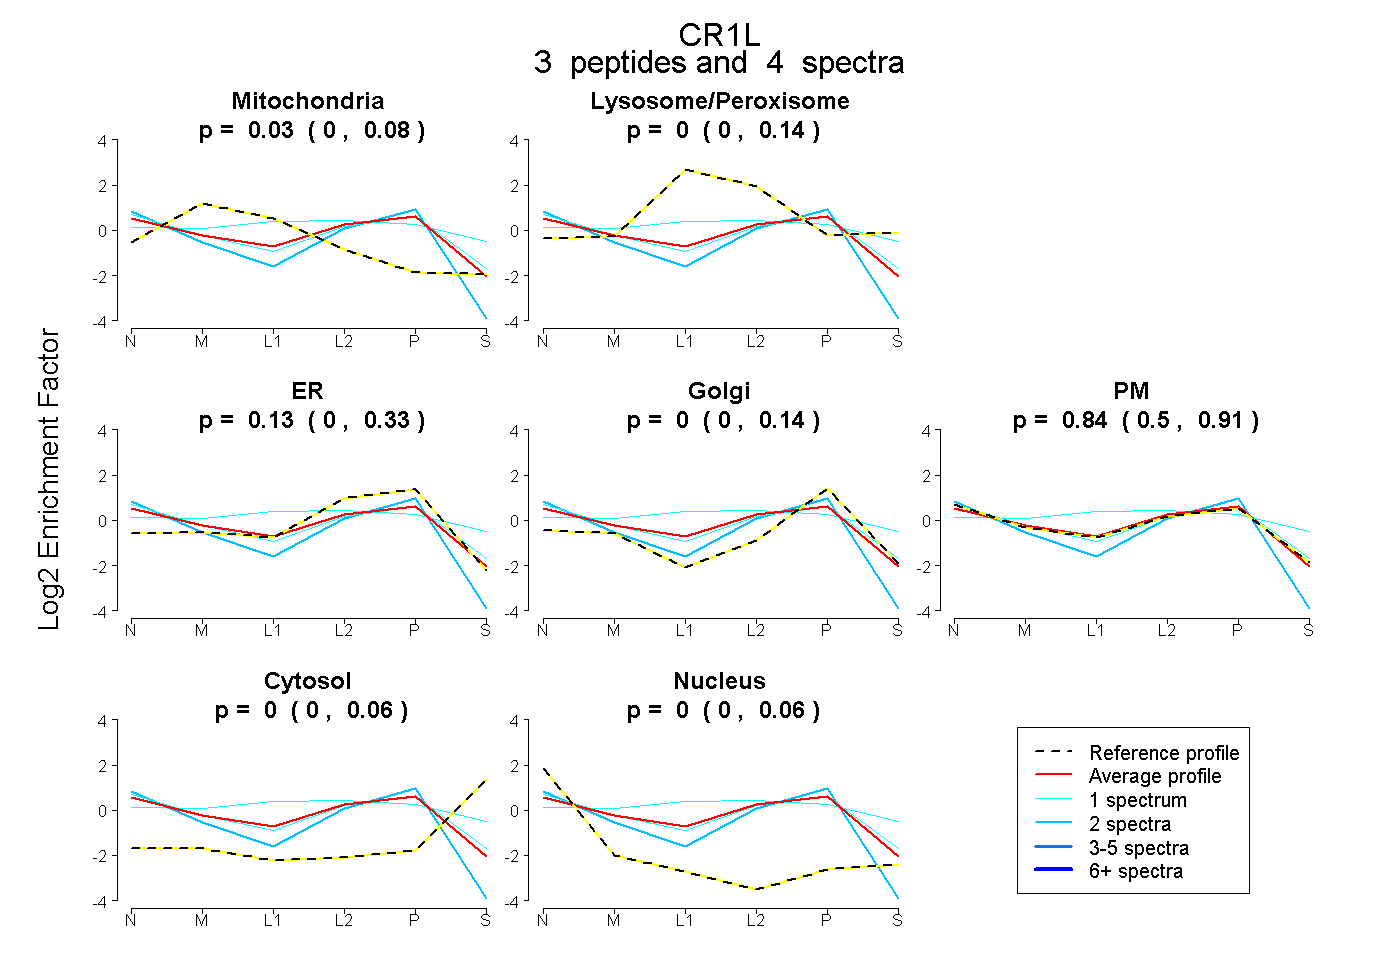 |
0.030 0.000 | 0.084 |
0.000 0.000 | 0.144 |
0.128 0.000 | 0.333 |
0.000 0.000 | 0.144 |
0.842 0.502 | 0.915 |
0.000 0.000 | 0.058 |
0.000 0.000 | 0.060 |
|||
| Plot | Lyso | Other | |||||||||||
| Expt C |
11 peptides |
55 spectra |
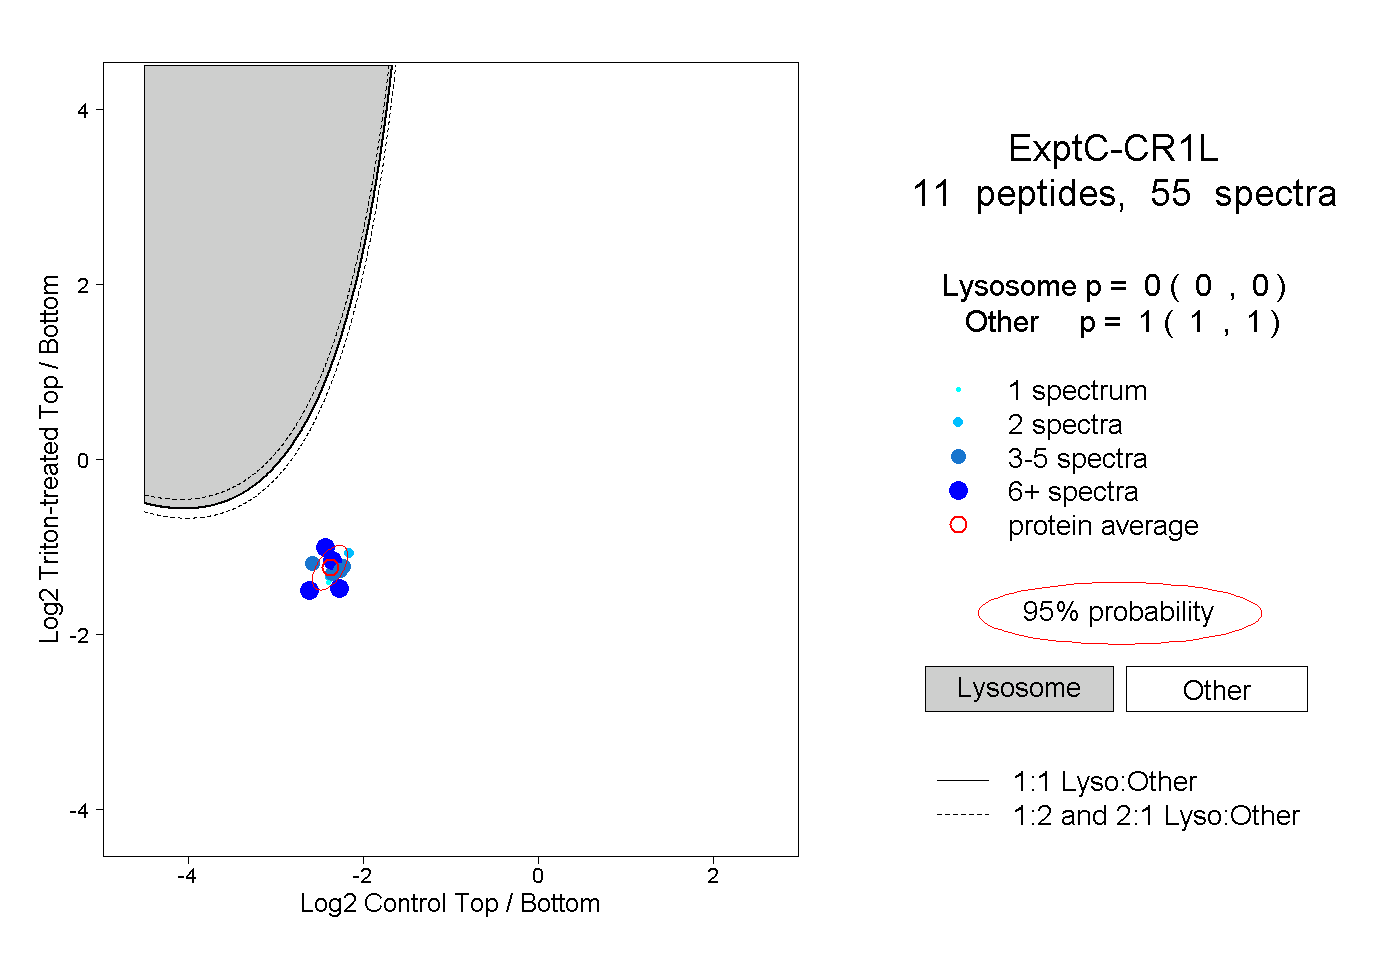 |
0.000 0.000 | 0.000 |
1.000 1.000 | 1.000 |
||||||||
| Plot | Lyso | Other | |||||||||||
| Expt D |
3 peptides |
3 spectra |
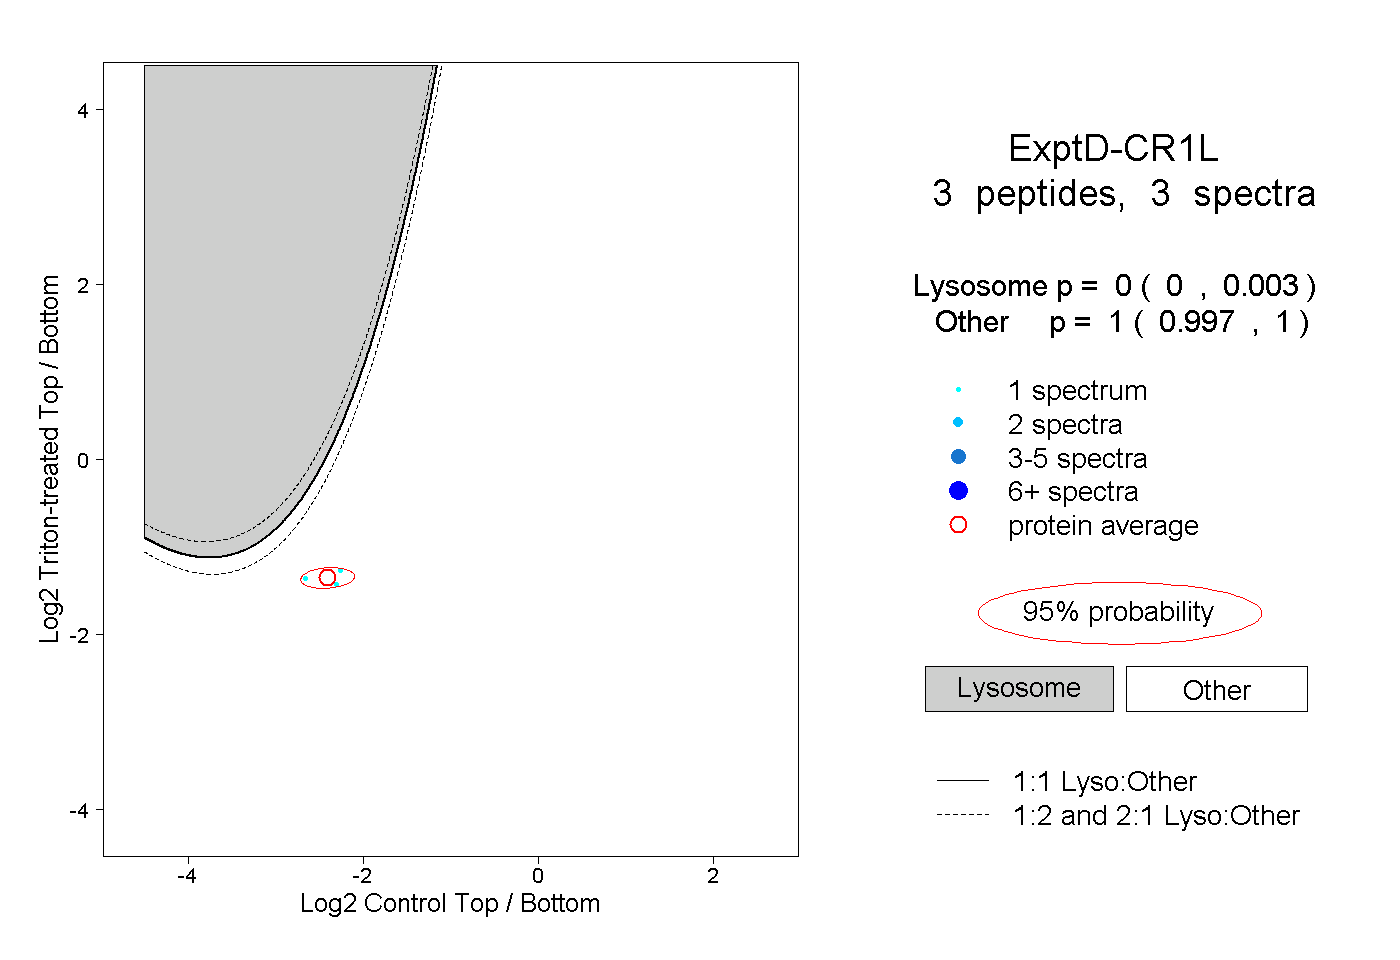 |
0.000 0.000 | 0.003 |
1.000 0.997 | 1.000 |