 2
2peptides
spectra
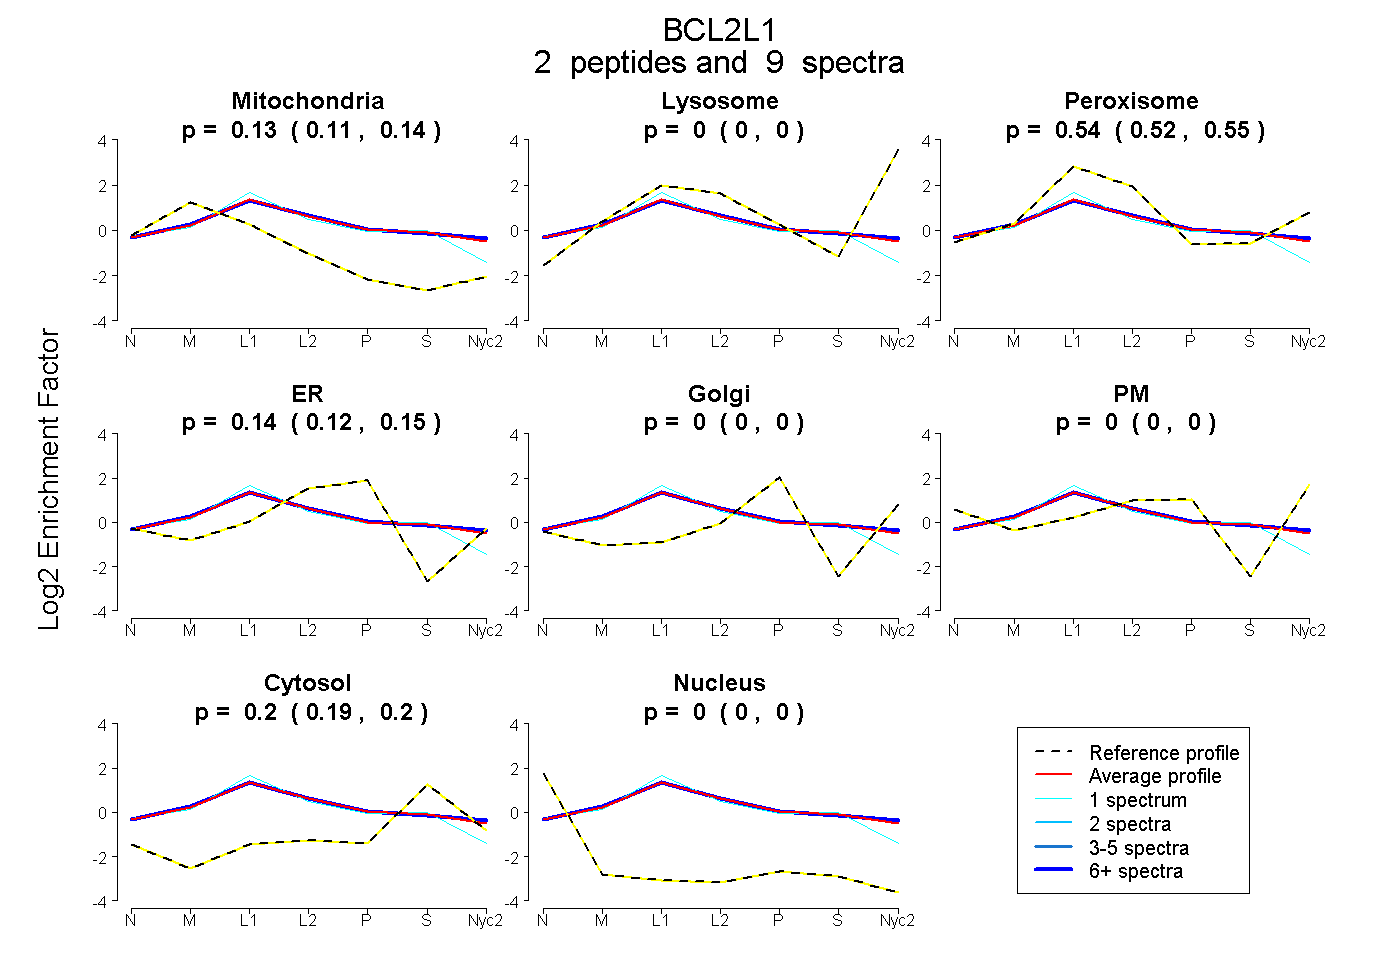
0.112 | 0.137
0.000 | 0.000
0.524 | 0.551
0.123 | 0.147
0.000 | 0.003
0.000 | 0.000
0.190 | 0.204
0.000 | 0.000
2peptides
spectra
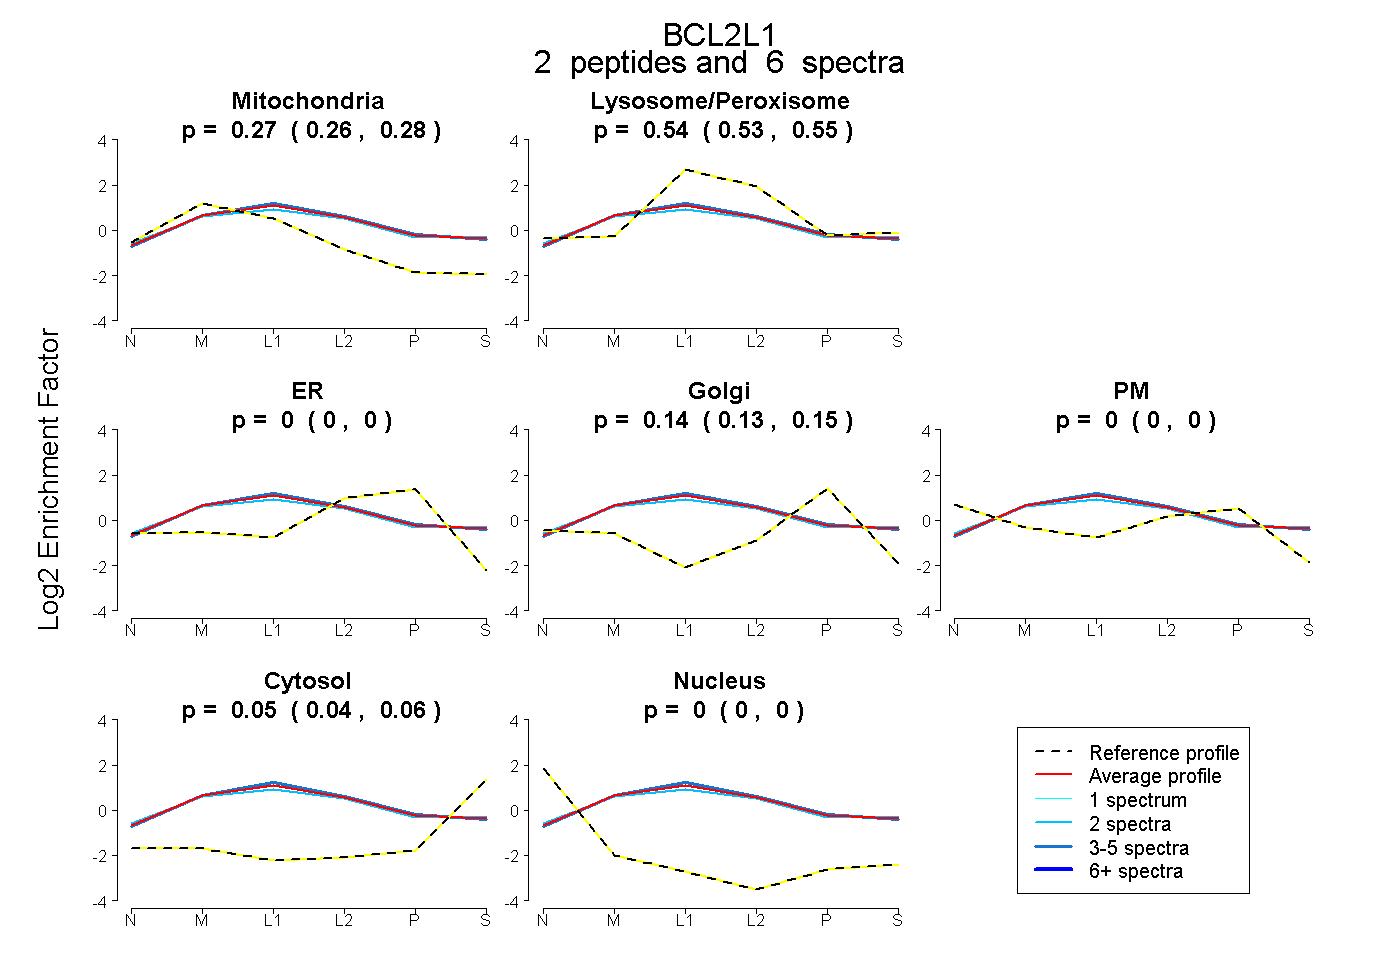
0.258 | 0.276
0.530 | 0.546
0.000 | 0.000
0.132 | 0.150
0.000 | 0.000
0.044 | 0.058
0.000 | 0.000
3peptides
spectra
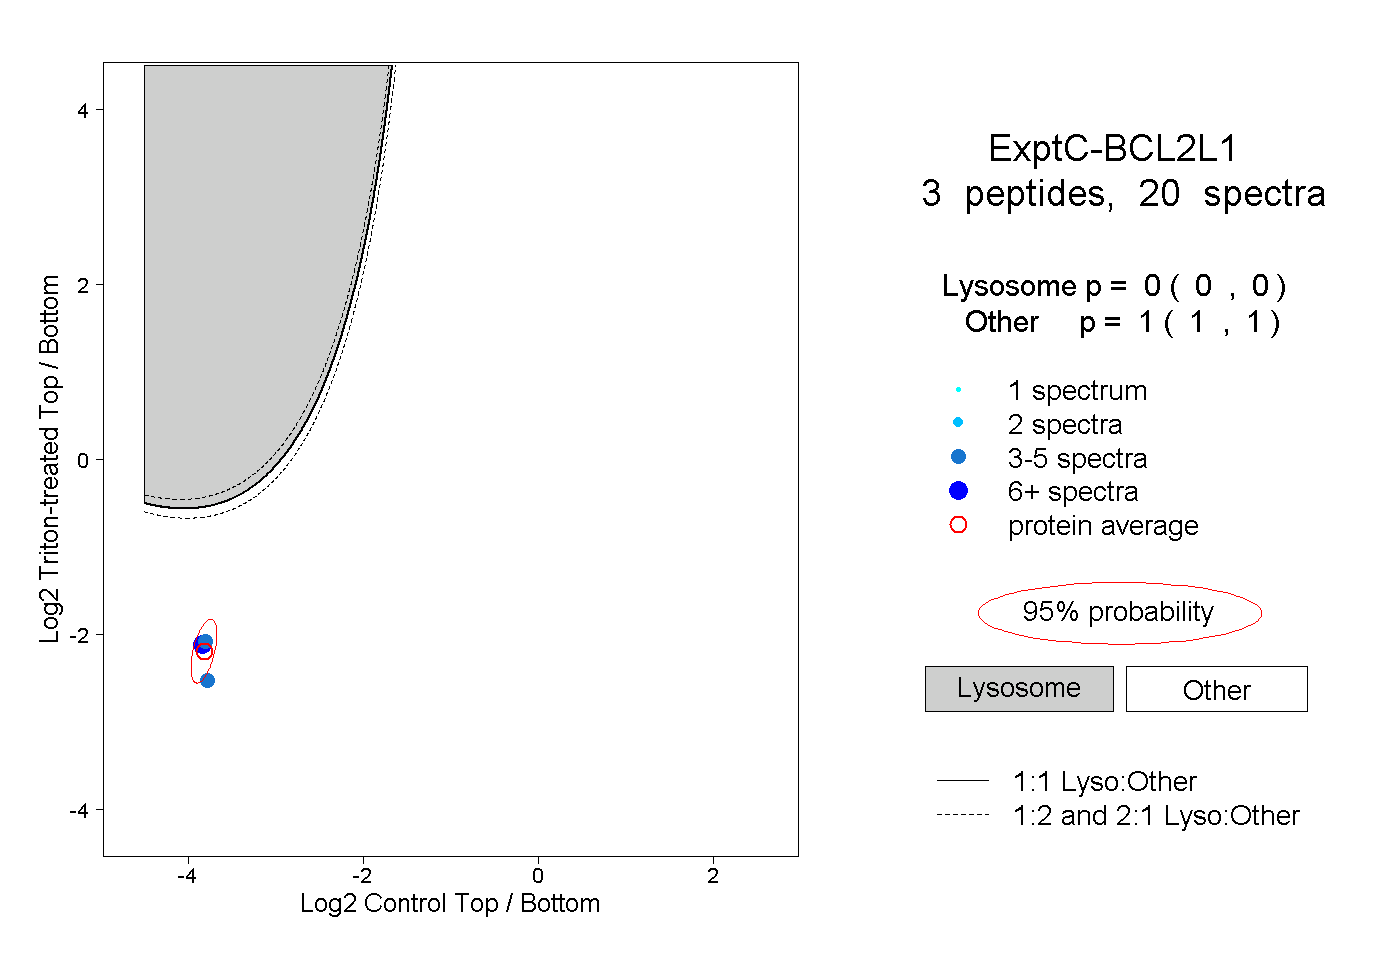
0.000 | 0.000
1.000 | 1.000
1peptide
spectra
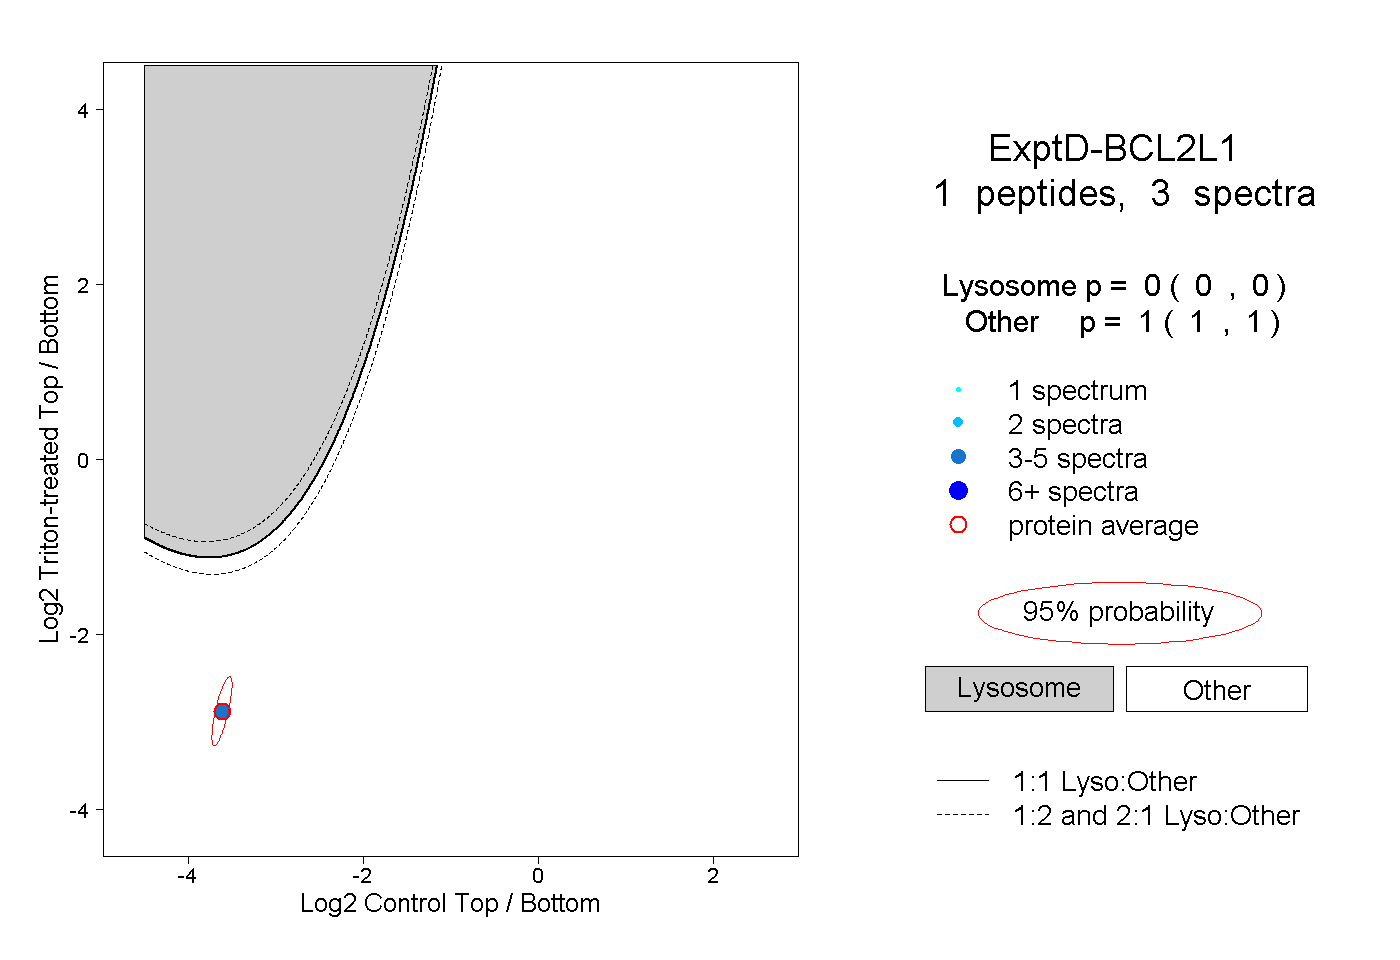
0.000 | 0.000
1.000 | 1.000