 3
3peptides
spectra
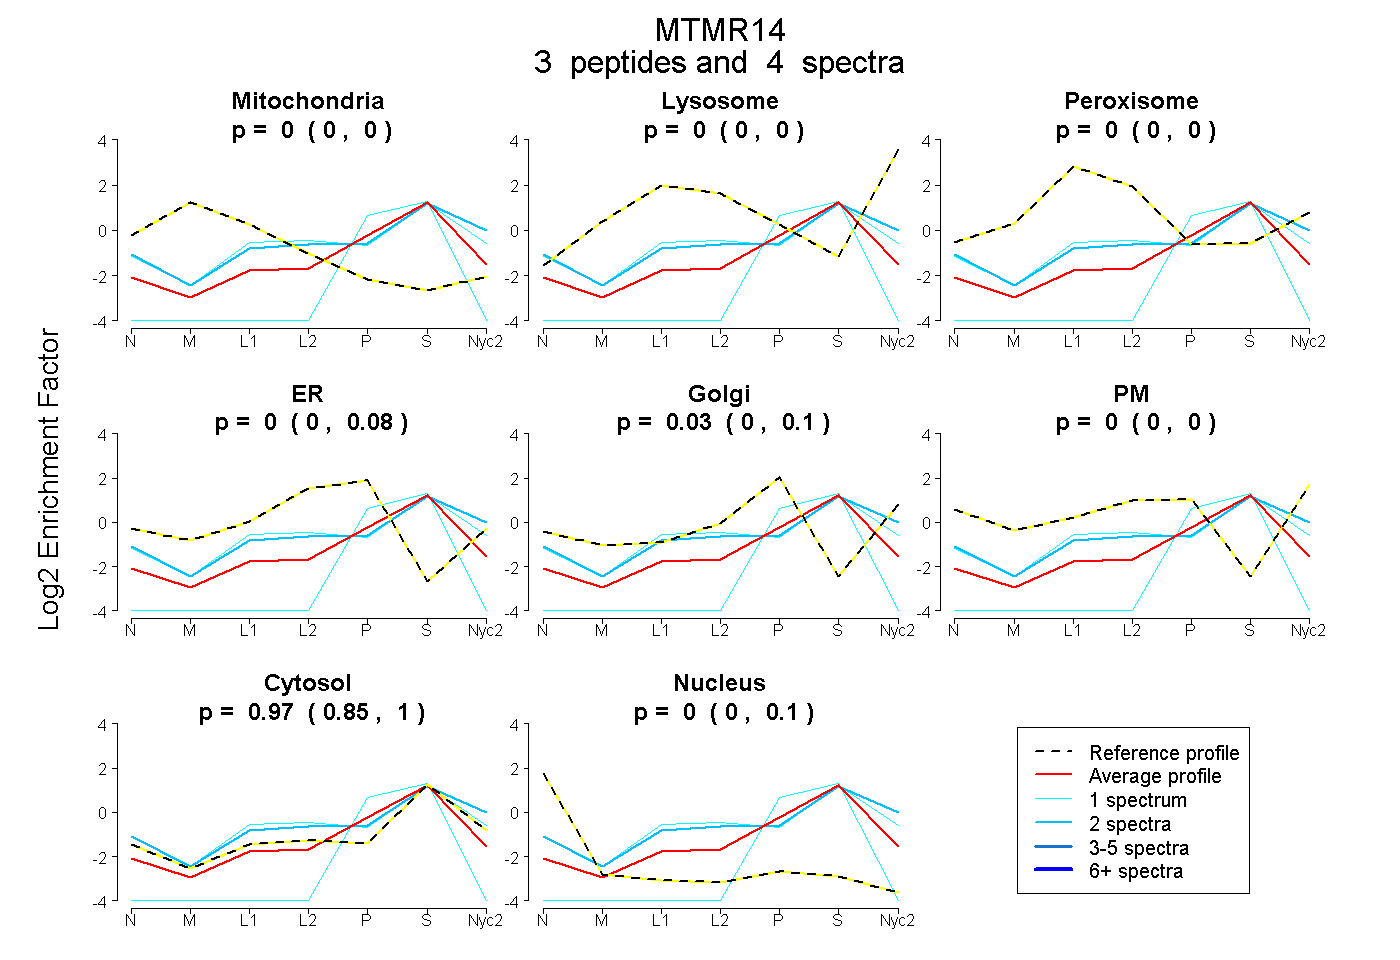
0.000 | 0.000
0.000 | 0.000
0.000 | 0.000
0.000 | 0.079
0.000 | 0.101
0.000 | 0.000
0.853 | 0.997
0.000 | 0.101
| Plot | Mito | Lyso | Perox | ER | Golgi | PM | Cytosol | Nucleus | |||||
| Expt A |
3 peptides |
4 spectra |
|
0.000 0.000 | 0.000 |
0.000 0.000 | 0.000 |
0.000 0.000 | 0.000 |
0.000 0.000 | 0.079 |
0.031 0.000 | 0.101 |
0.000 0.000 | 0.000 |
0.969 0.853 | 0.997 |
0.000 0.000 | 0.101 |
| 1 spectrum, LQDLLHR | 0.000 | 0.000 | 0.000 | 0.000 | 0.000 | 0.000 | 0.822 | 0.178 | ||
| 1 spectrum, DAGFTVEDICMLR | 0.000 | 0.000 | 0.144 | 0.055 | 0.000 | 0.000 | 0.801 | 0.000 | ||
| 2 spectra, TPLFISLLR | 0.000 | 0.125 | 0.000 | 0.007 | 0.014 | 0.039 | 0.815 | 0.000 |
| Plot | Mito | Lyso or Perox | ER | Golgi | PM | Cytosol | Nucleus | ||||||
| Expt B |
1 peptide |
1 spectrum |
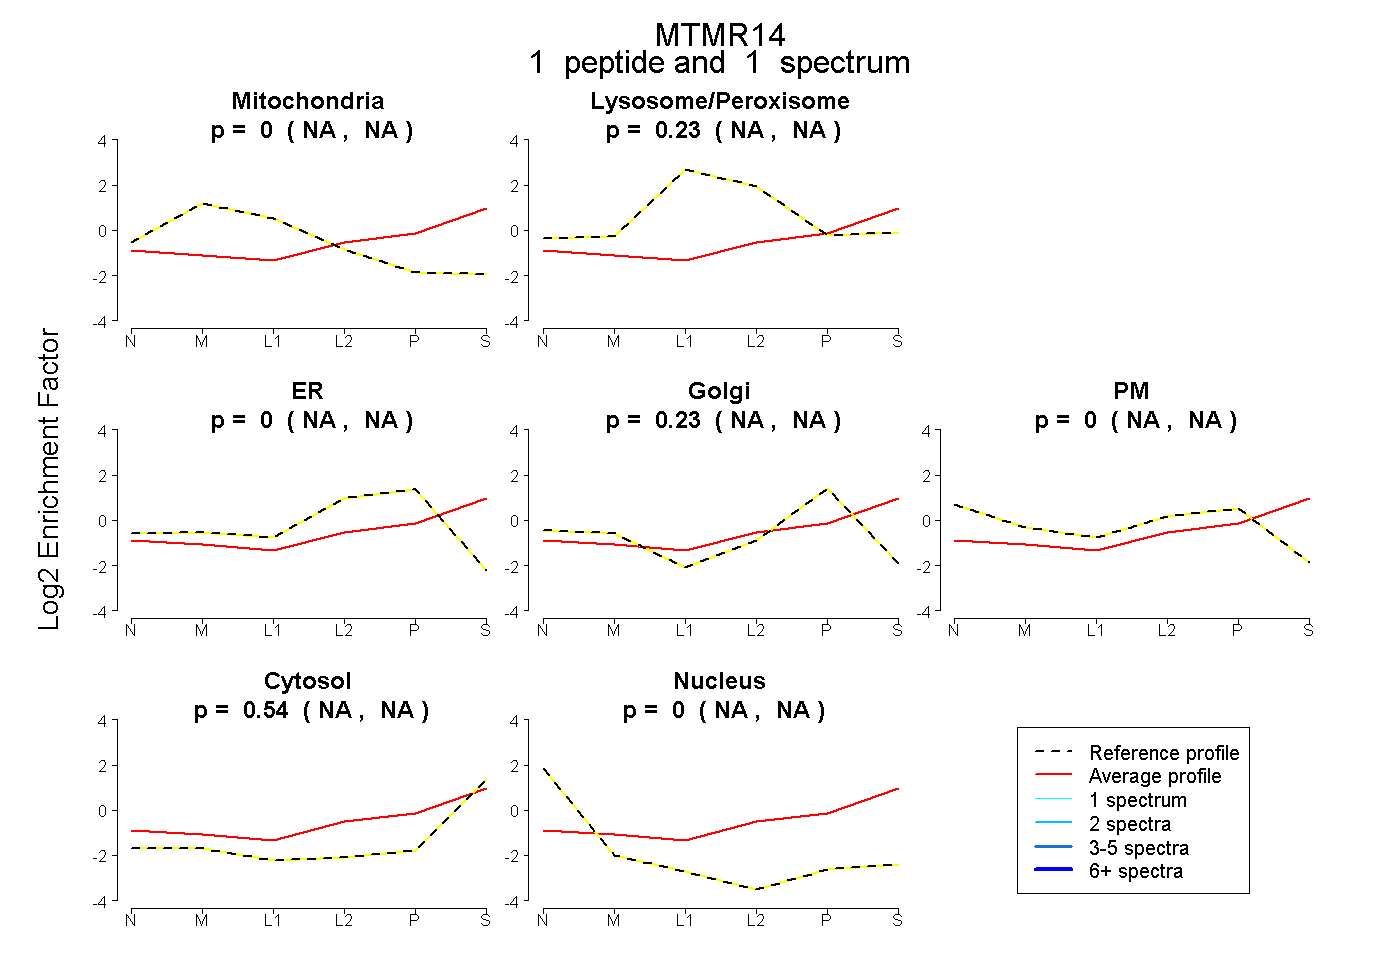 |
0.000 NA | NA |
0.235 NA | NA |
0.000 NA | NA |
0.229 NA | NA |
0.000 NA | NA |
0.536 NA | NA |
0.000 NA | NA |
|||
| Plot | Lyso | Other | |||||||||||
| Expt C |
4 peptides |
6 spectra |
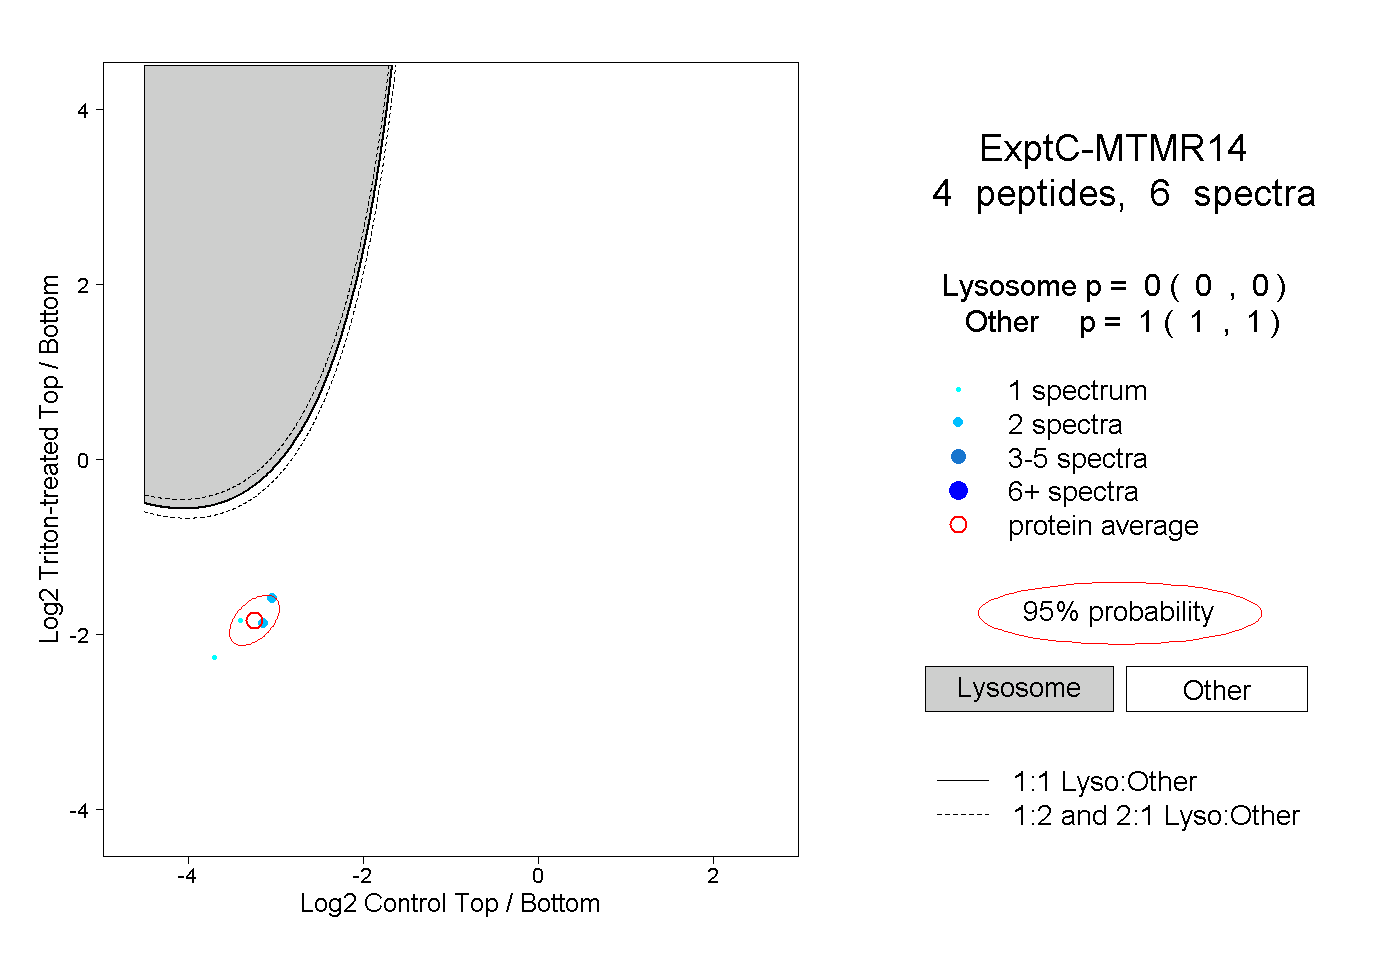 |
0.000 0.000 | 0.000 |
1.000 1.000 | 1.000 |