EHD4
[ENSRNOP00000010701]
Main page
| | | Plot |
Mito |
Lyso |
|
Perox |
ER |
Golgi |
PM |
Cytosol |
Nucleus |
|
| Expt A |
 9
9
peptides |
26
spectra |
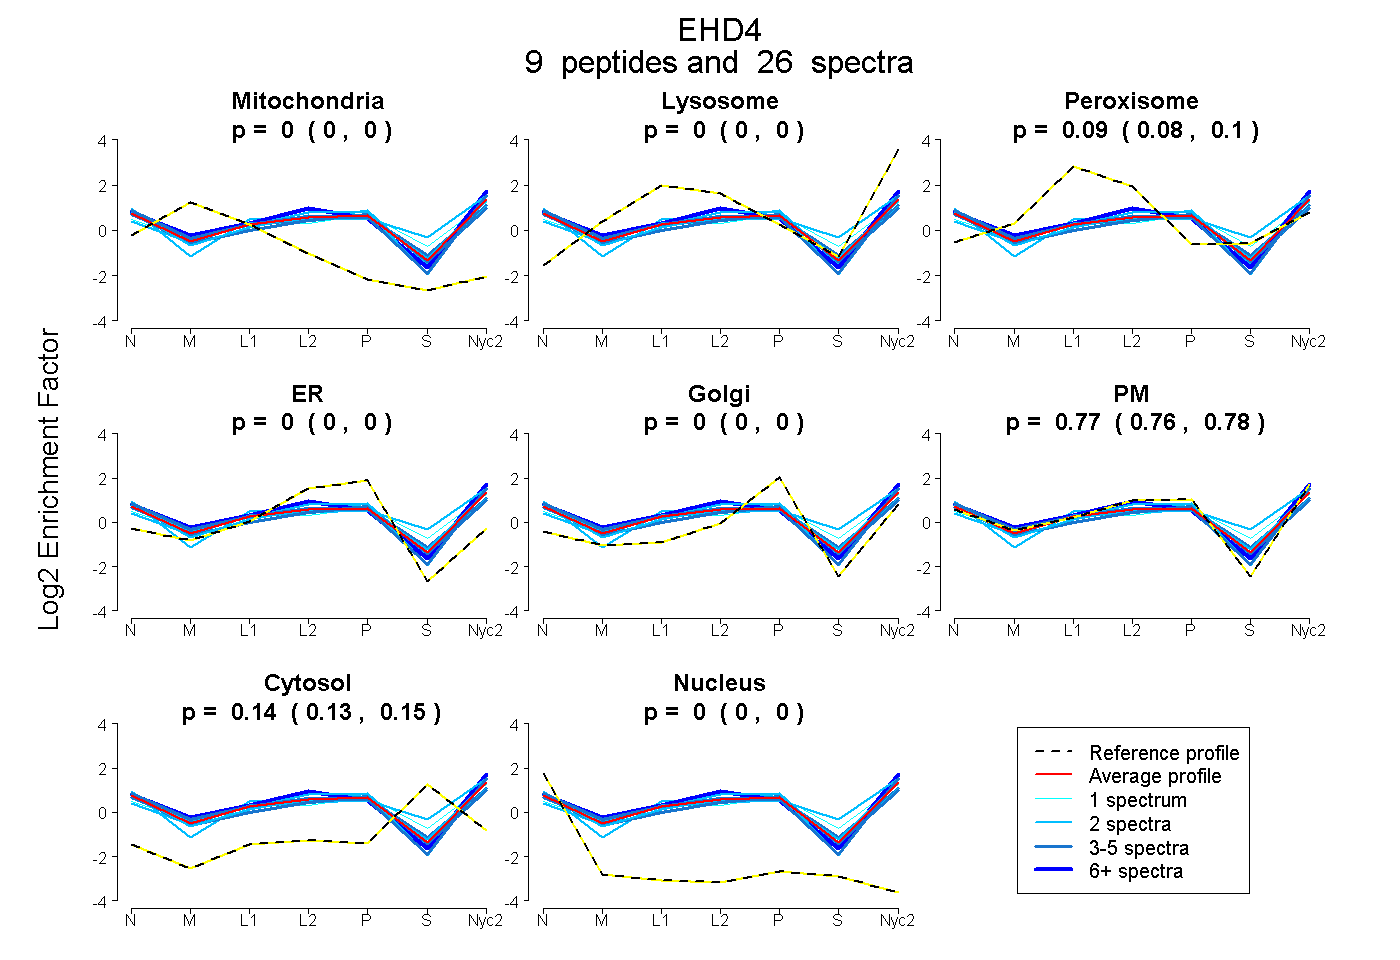 |
0.000
0.000 | 0.000 |
0.000
0.000 | 0.000 |
|
0.089
0.082 | 0.095 |
0.000
0.000 | 0.000 |
0.000
0.000 | 0.000 |
0.769
0.758 | 0.778 |
0.142
0.135 | 0.147 |
0.000
0.000 | 0.000 |
|
| | | Plot |
Mito |
|
Lyso or Perox |
|
ER |
Golgi |
PM |
Cytosol |
Nucleus |
|
| Expt B |
2
peptides |
4
spectra |
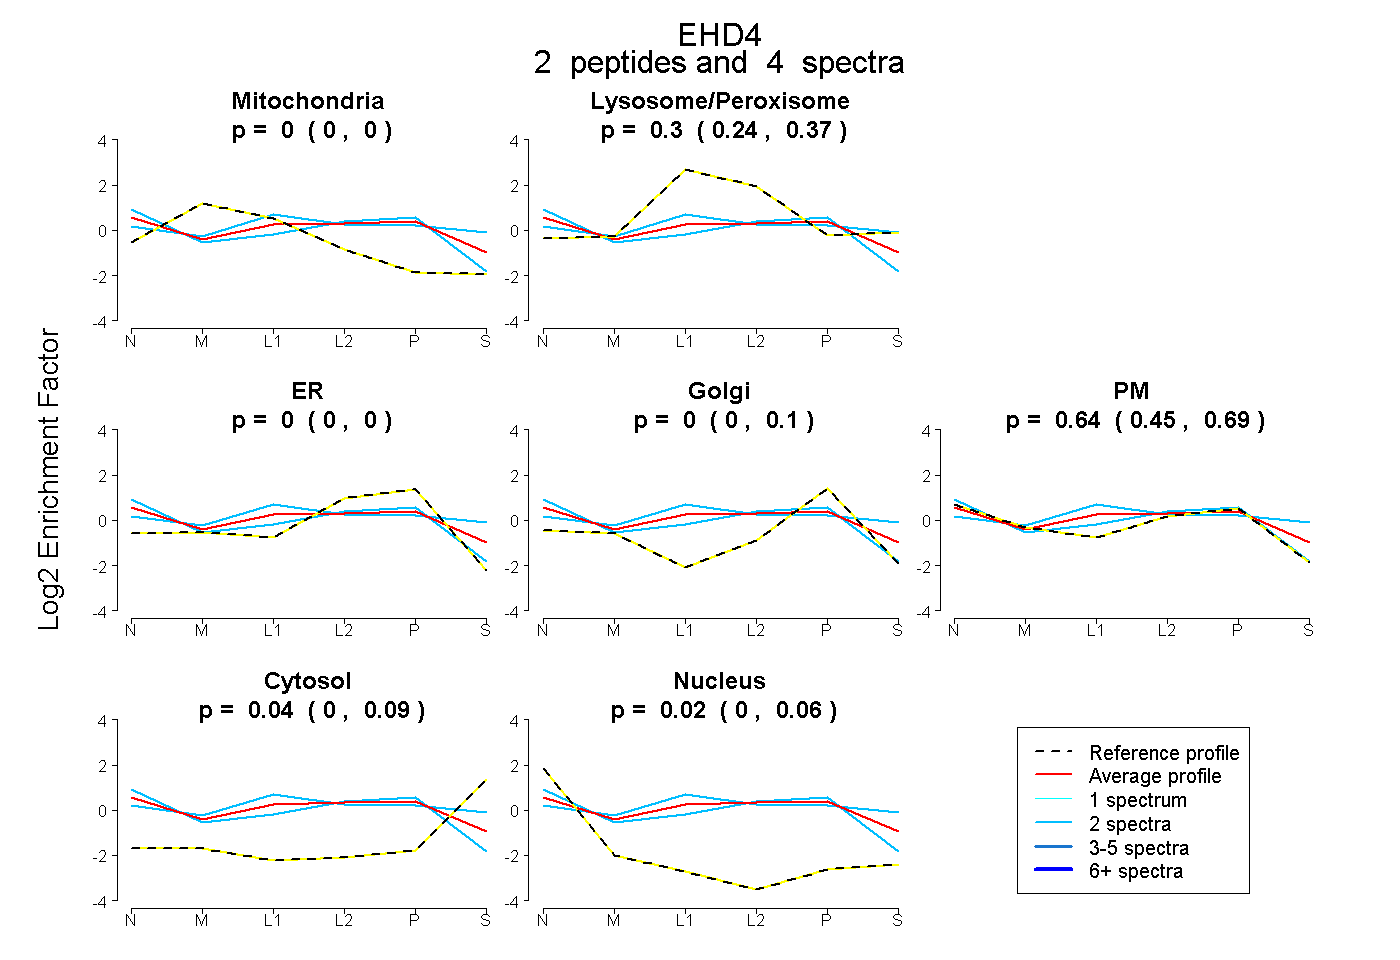 |
0.000
0.000 | 0.000 |
|
0.297
0.241 | 0.371 |
|
0.000
0.000 | 0.000 |
0.000
0.000 | 0.099 |
0.642
0.449 | 0.693 |
0.045
0.000 | 0.095 |
0.017
0.000 | 0.056 |
|
| 2 spectra, EYQISAGDFPEVK |
0.000 |
|
0.457 |
|
0.000 |
0.015 |
0.371 |
0.157 |
0.000 |
|
| 2 spectra, LFEAEAQDLFR |
0.000 |
|
0.117 |
|
0.000 |
0.000 |
0.881 |
0.000 |
0.002 |
|
| | | Plot |
|
Lyso |
|
|
|
|
|
|
|
Other |
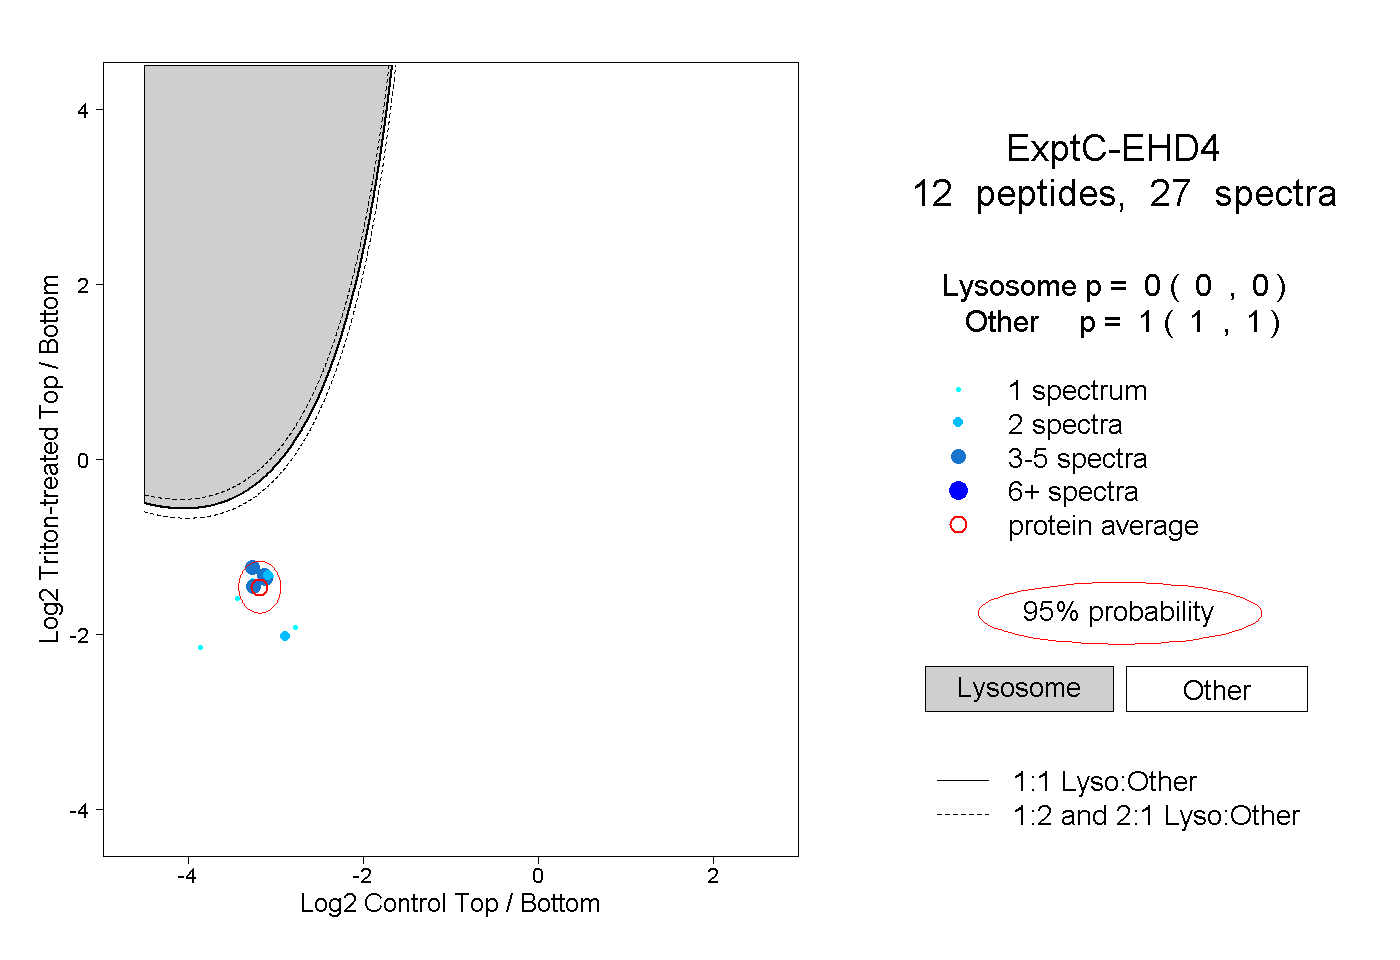
| Expt C |
12
peptides |
27
spectra |
 |
|
0.000
0.000 | 0.000 |
|
|
|
|
|
|
|
1.000
1.000 | 1.000 |
| | | Plot |
|
Lyso |
|
|
|
|
|
|
|
Other |
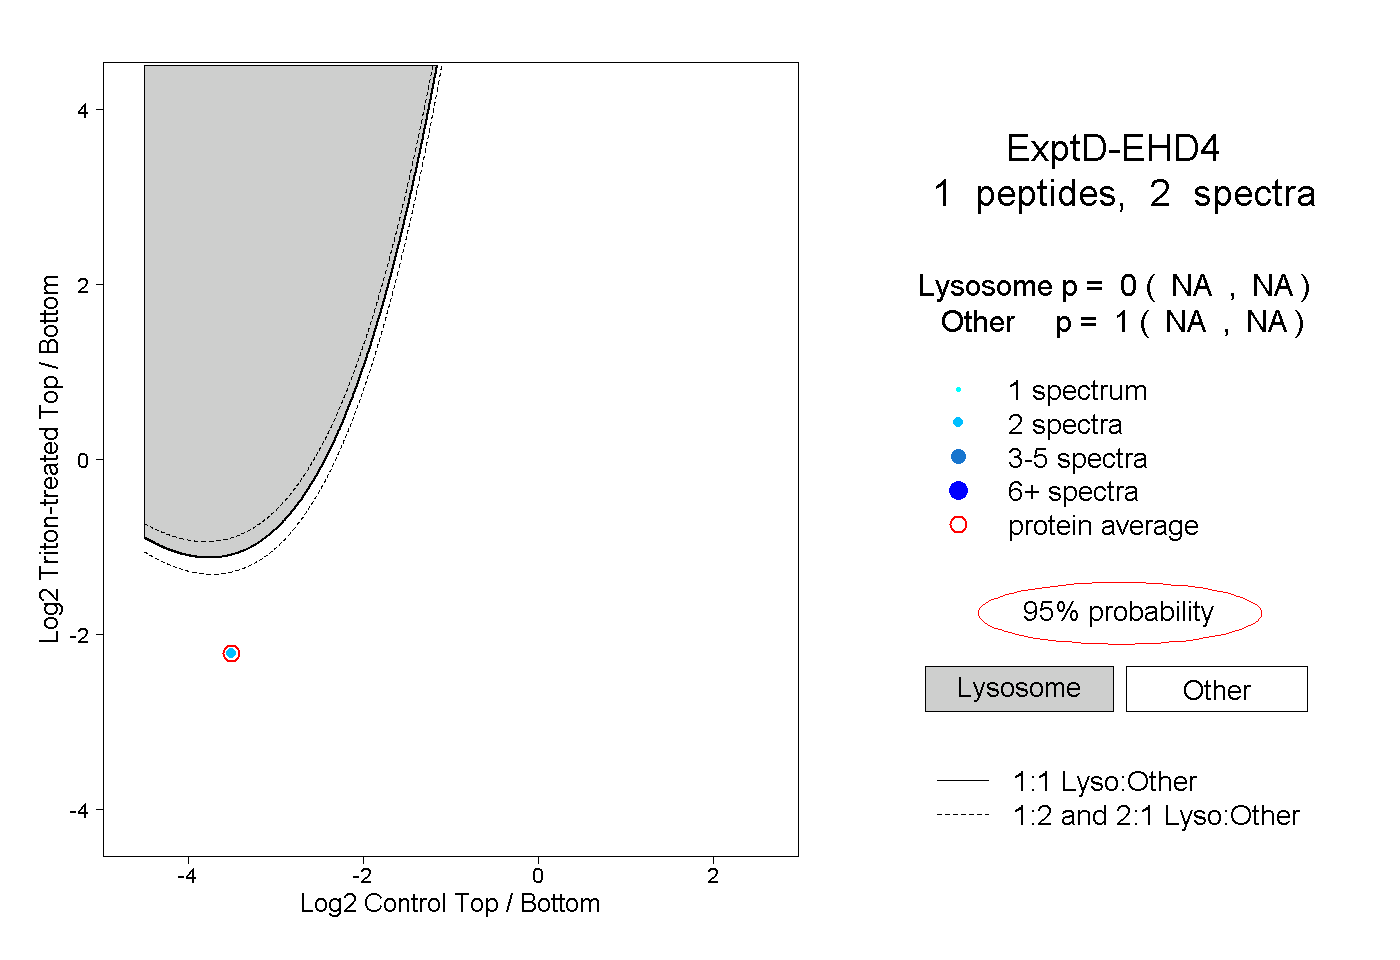
| Expt D |
1
peptide |
2
spectra |
 |
|
0.000
NA | NA |
|
|
|
|
|
|
|
1.000
NA | NA |