 4
4peptides
spectra
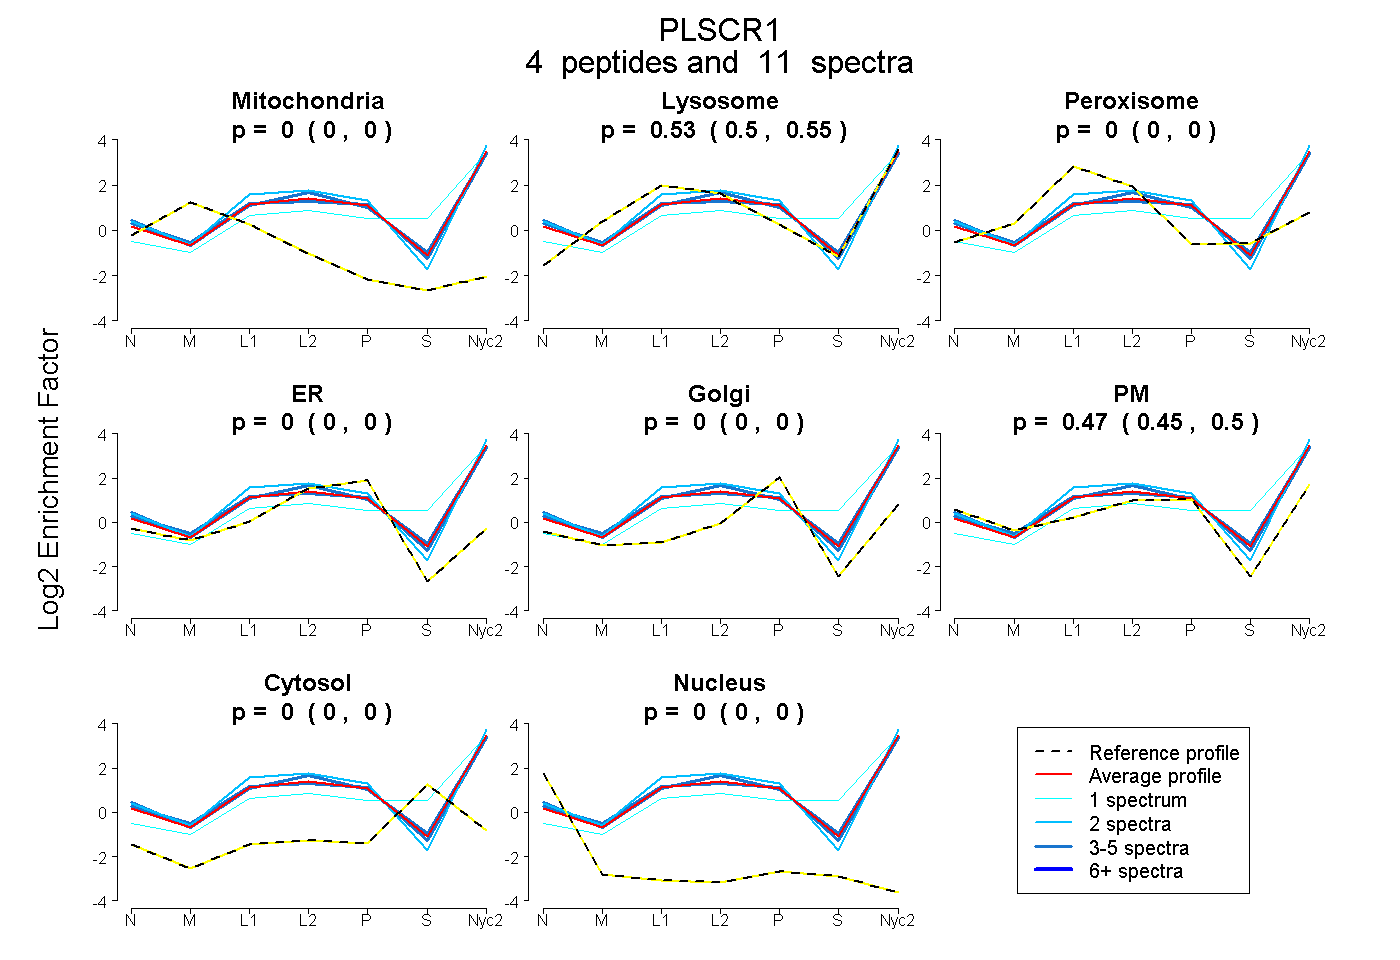
0.000 | 0.000
0.496 | 0.549
0.000 | 0.000
0.000 | 0.000
0.000 | 0.000
0.446 | 0.497
0.000 | 0.000
0.000 | 0.000
4peptides
spectra
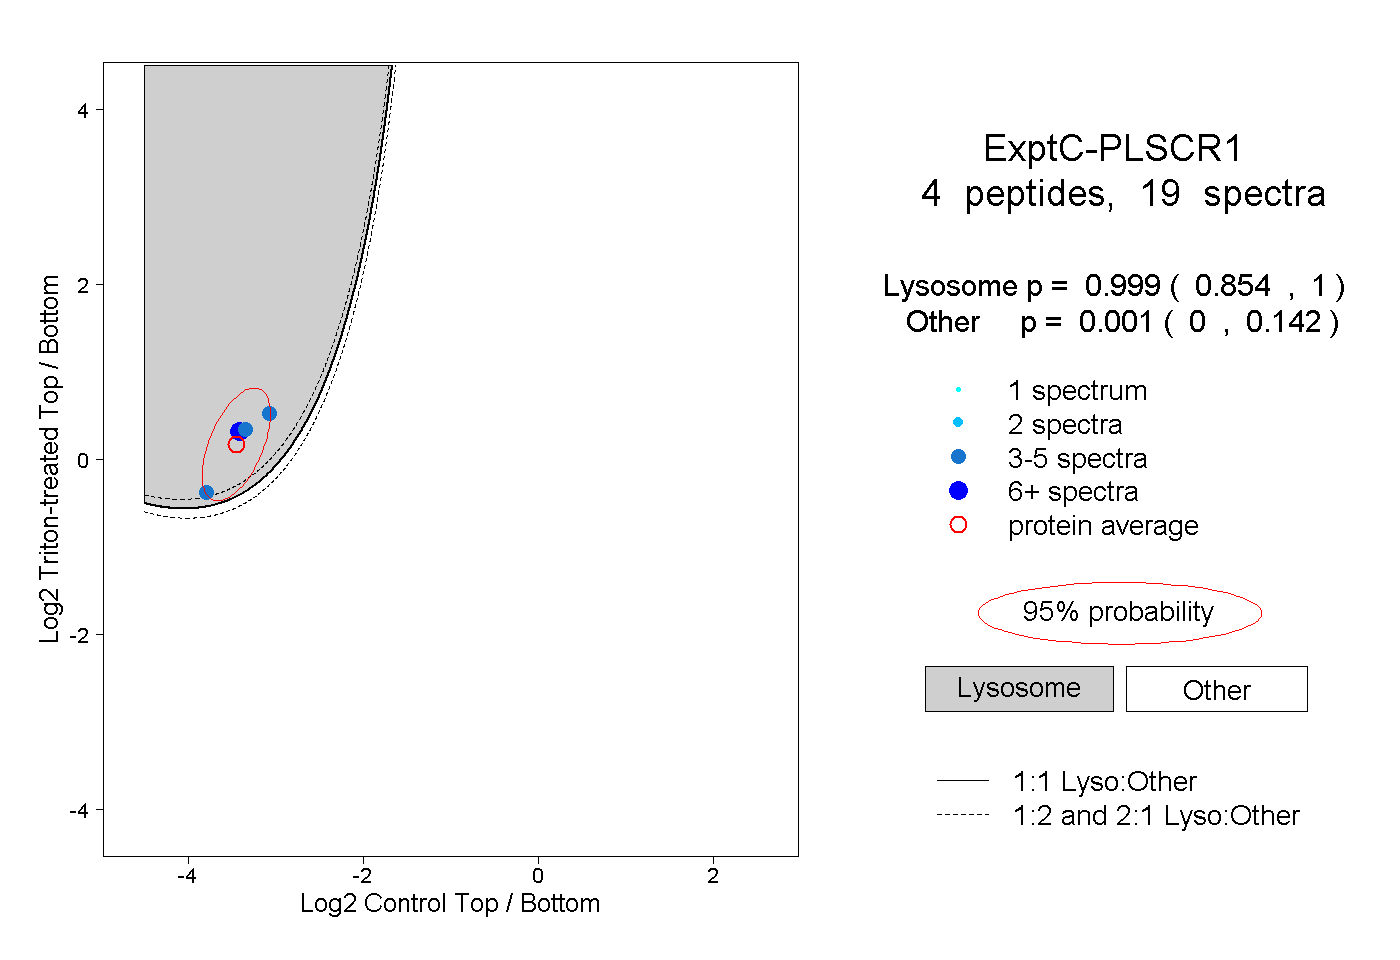
0.854 | 1.000
0.000 | 0.142
1peptide
spectrum
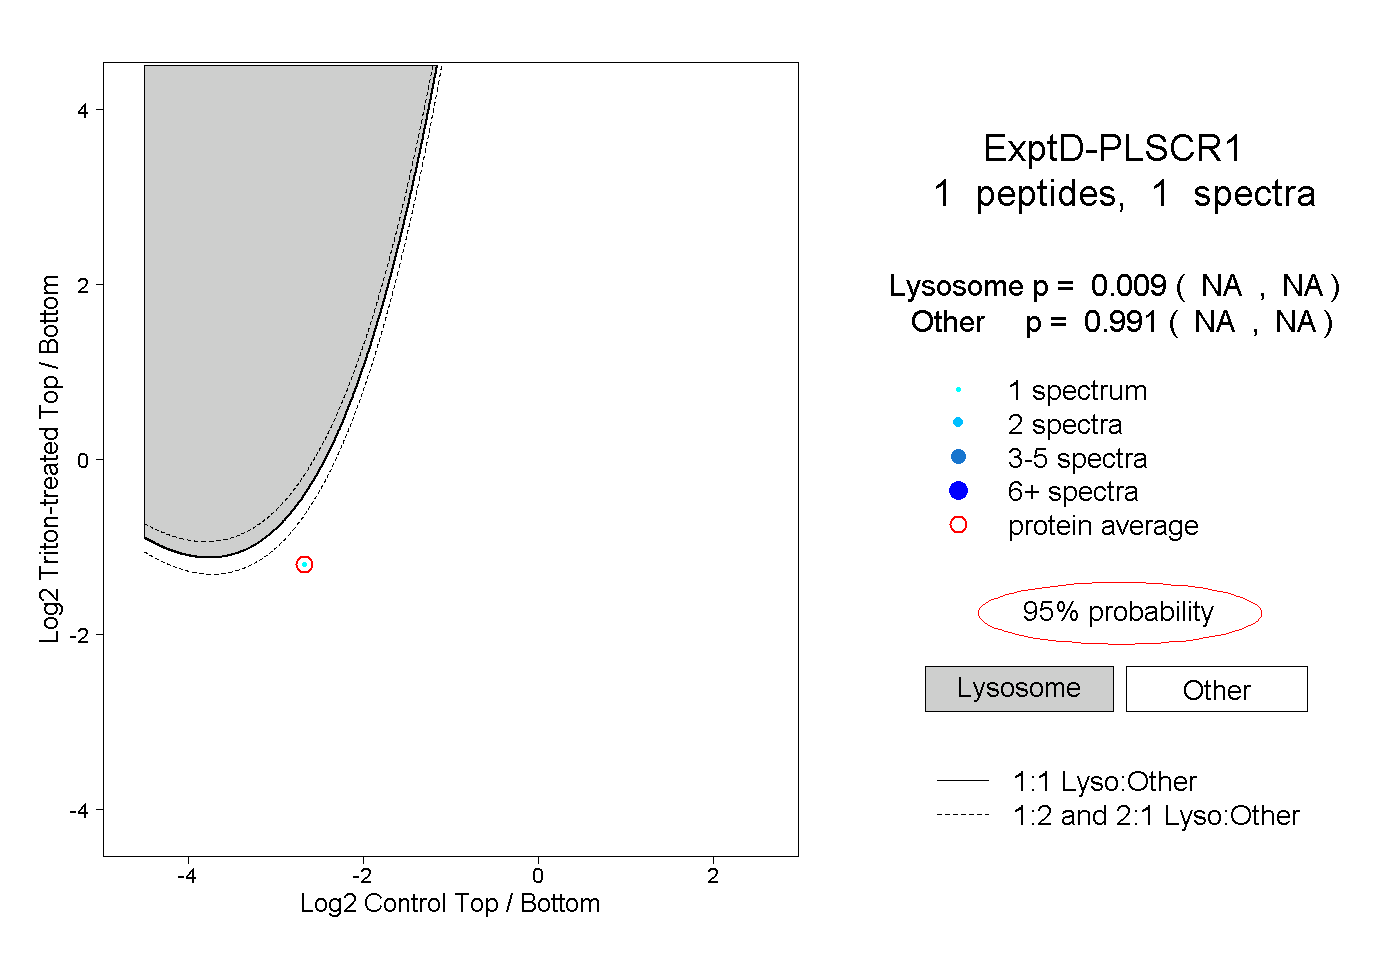
NA | NA
NA | NA