 4
4peptides
spectra
0.000 | 0.000
0.496 | 0.549
0.000 | 0.000
0.000 | 0.000
0.000 | 0.000
0.446 | 0.497
0.000 | 0.000
0.000 | 0.000
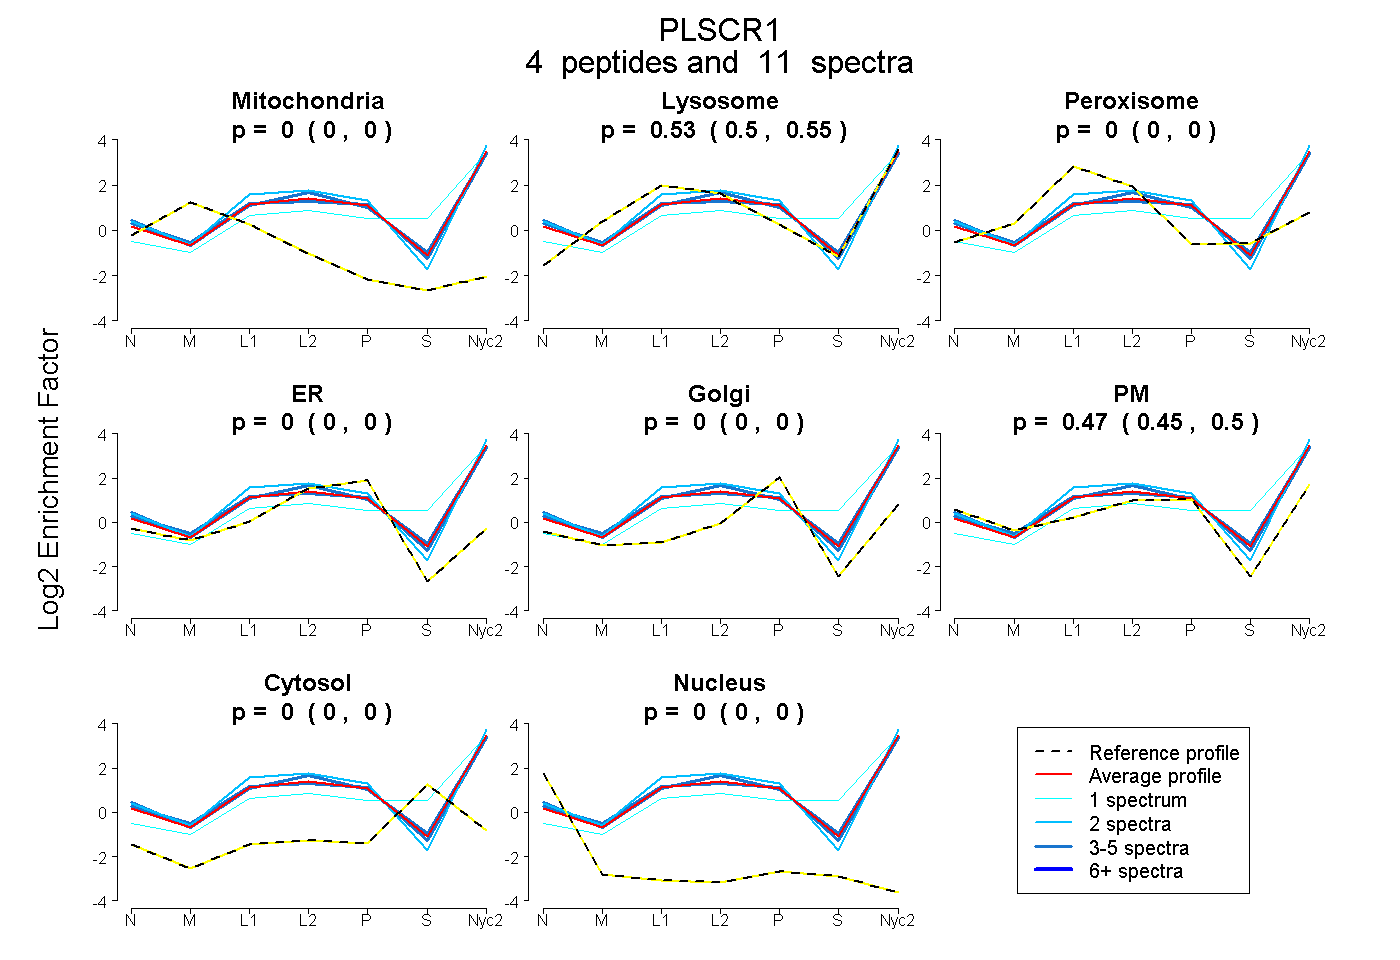
| Plot | Mito | Lyso | Perox | ER | Golgi | PM | Cytosol | Nucleus | |||||
| Expt A |
4 peptides |
11 spectra |
|
0.000 0.000 | 0.000 |
0.525 0.496 | 0.549 |
0.000 0.000 | 0.000 |
0.000 0.000 | 0.000 |
0.000 0.000 | 0.000 |
0.475 0.446 | 0.497 |
0.000 0.000 | 0.000 |
0.000 0.000 | 0.000 |
| 2 spectra, VYFAVEDTDCCTR | 0.000 | 0.530 | 0.000 | 0.000 | 0.000 | 0.470 | 0.000 | 0.000 | ||
| 1 spectrum, QWSGFVR | 0.000 | 0.695 | 0.000 | 0.000 | 0.000 | 0.053 | 0.252 | 0.000 | ||
| 5 spectra, EVMTLERPLR | 0.000 | 0.491 | 0.000 | 0.000 | 0.000 | 0.509 | 0.000 | 0.000 | ||
| 3 spectra, NCCGASRPFTLR | 0.000 | 0.503 | 0.000 | 0.000 | 0.000 | 0.497 | 0.000 | 0.000 |
| Plot | Lyso | Other | |||||||||||
| Expt C |
4 peptides |
19 spectra |
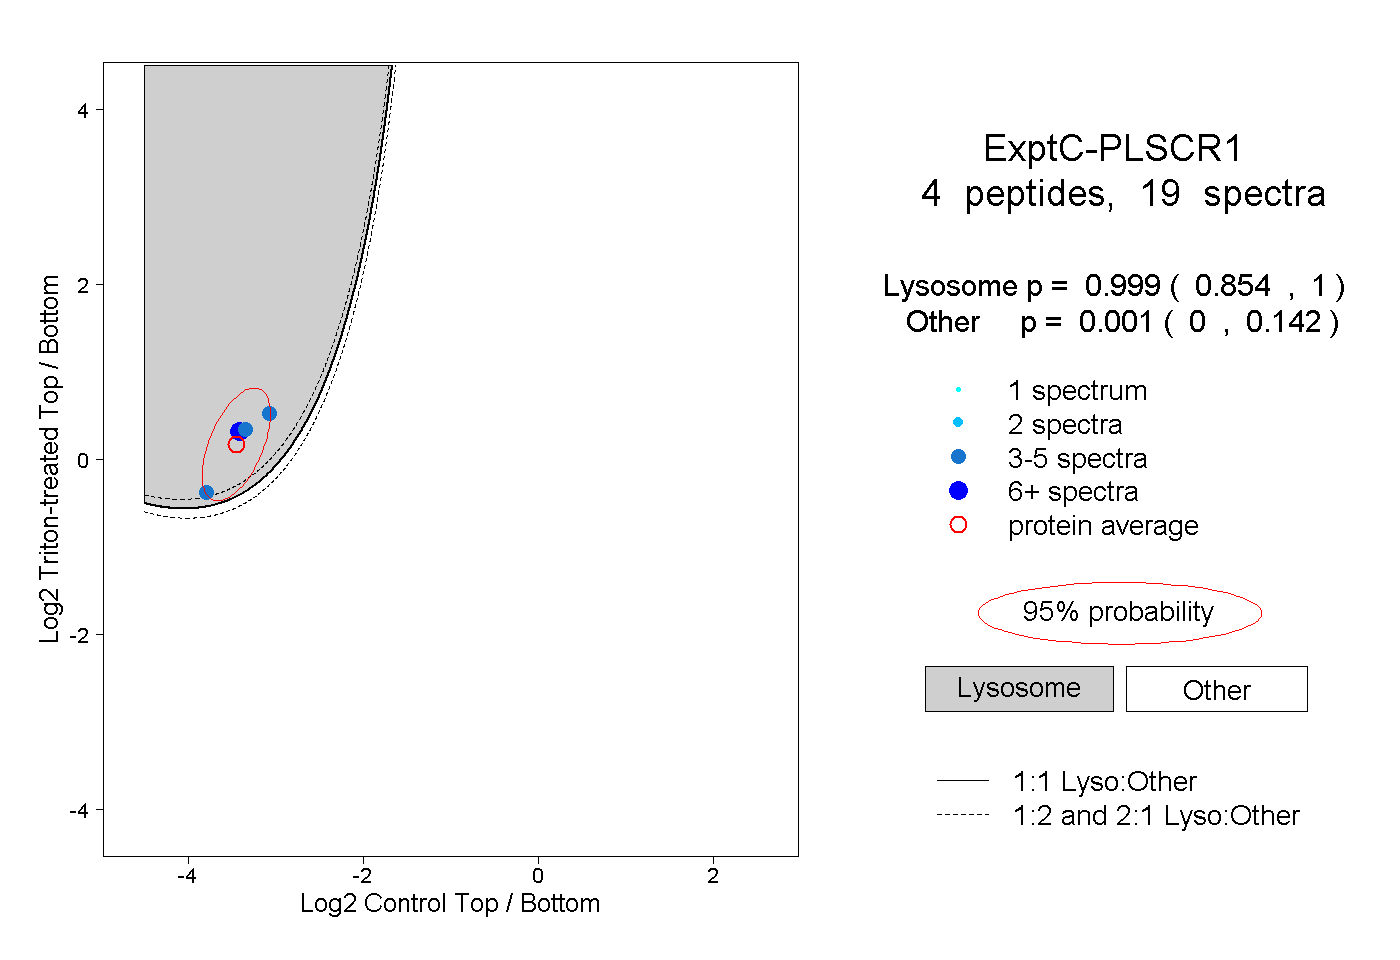 |
0.999 0.854 | 1.000 |
0.001 0.000 | 0.142 |
||||||||
| Plot | Lyso | Other | |||||||||||
| Expt D |
1 peptide |
1 spectrum |
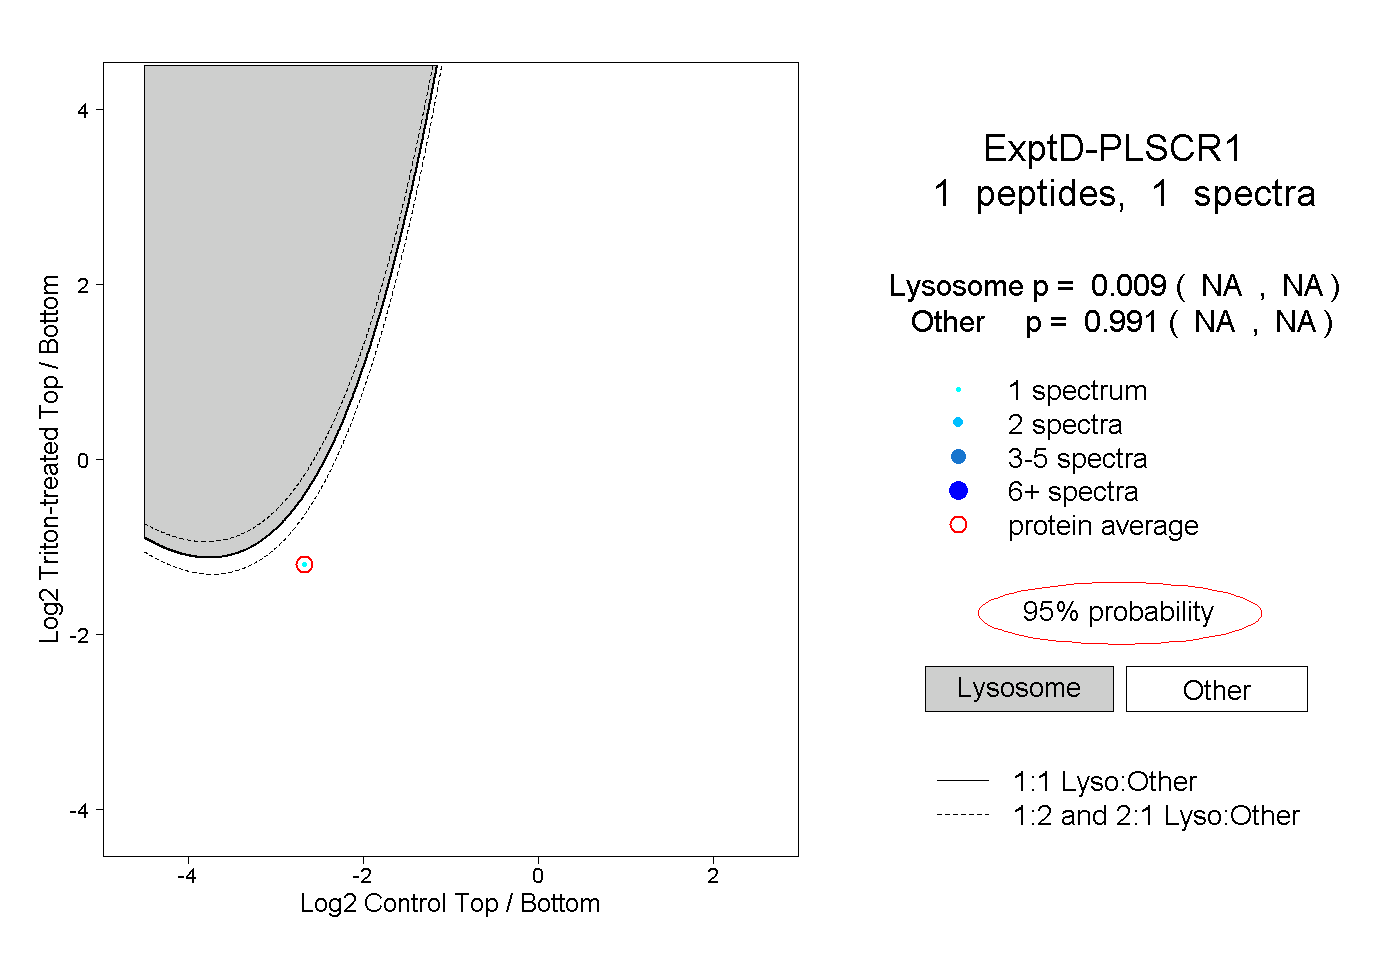 |
0.009 NA | NA |
0.991 NA | NA |