 2
2peptides
spectra
0.000 | 0.000
0.000 | 0.000
0.000 | 0.000
0.218 | 0.265
0.095 | 0.147
0.385 | 0.440
0.207 | 0.228
0.000 | 0.000
2peptides
spectra
0.000 | 0.000
1.000 | 1.000
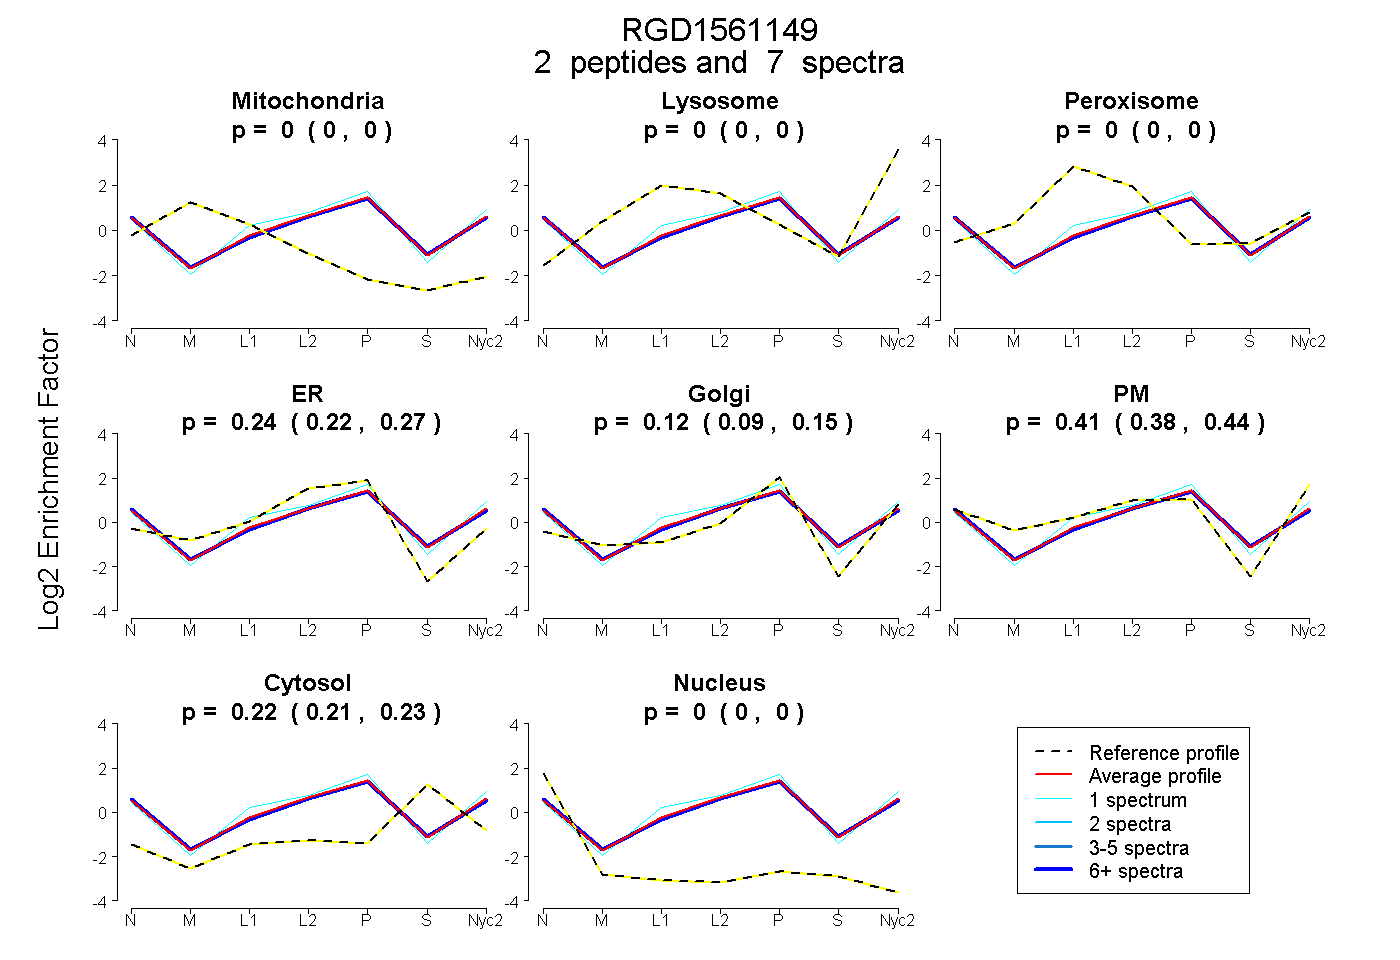
| Plot | Mito | Lyso | Perox | ER | Golgi | PM | Cytosol | Nucleus | |||||
| Expt A |
2 peptides |
7 spectra |
|
0.000 0.000 | 0.000 |
0.000 0.000 | 0.000 |
0.000 0.000 | 0.000 |
0.244 0.218 | 0.265 |
0.123 0.095 | 0.147 |
0.415 0.385 | 0.440 |
0.218 0.207 | 0.228 |
0.000 0.000 | 0.000 |
||
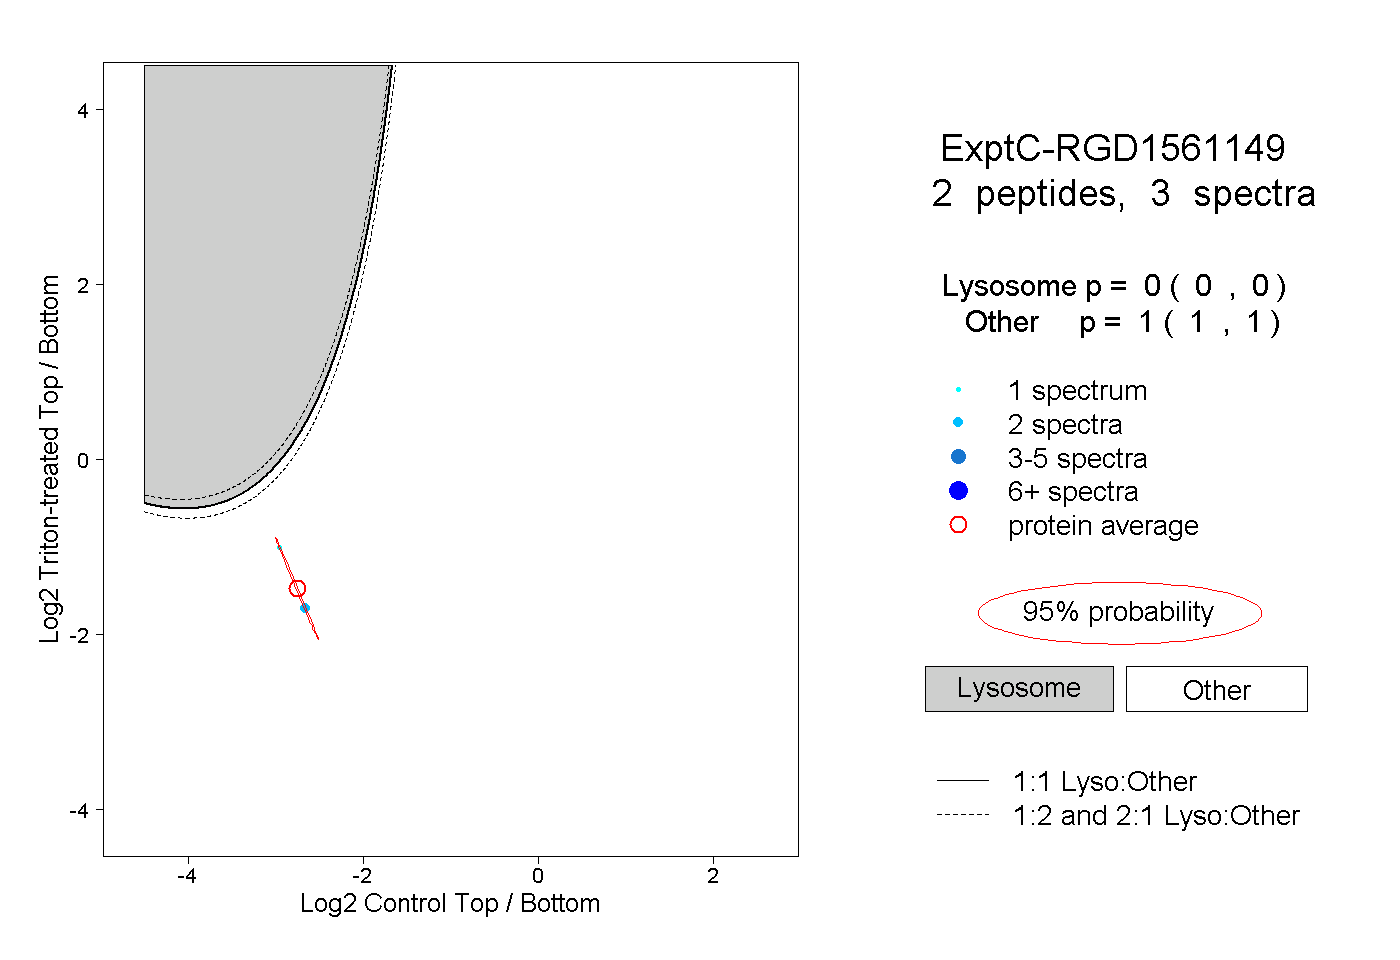
| Plot | Lyso | Other | |||||||||||
| Expt C |
2 peptides |
3 spectra |
|
0.000 0.000 | 0.000 |
1.000 1.000 | 1.000 |