 5
5peptides
spectra
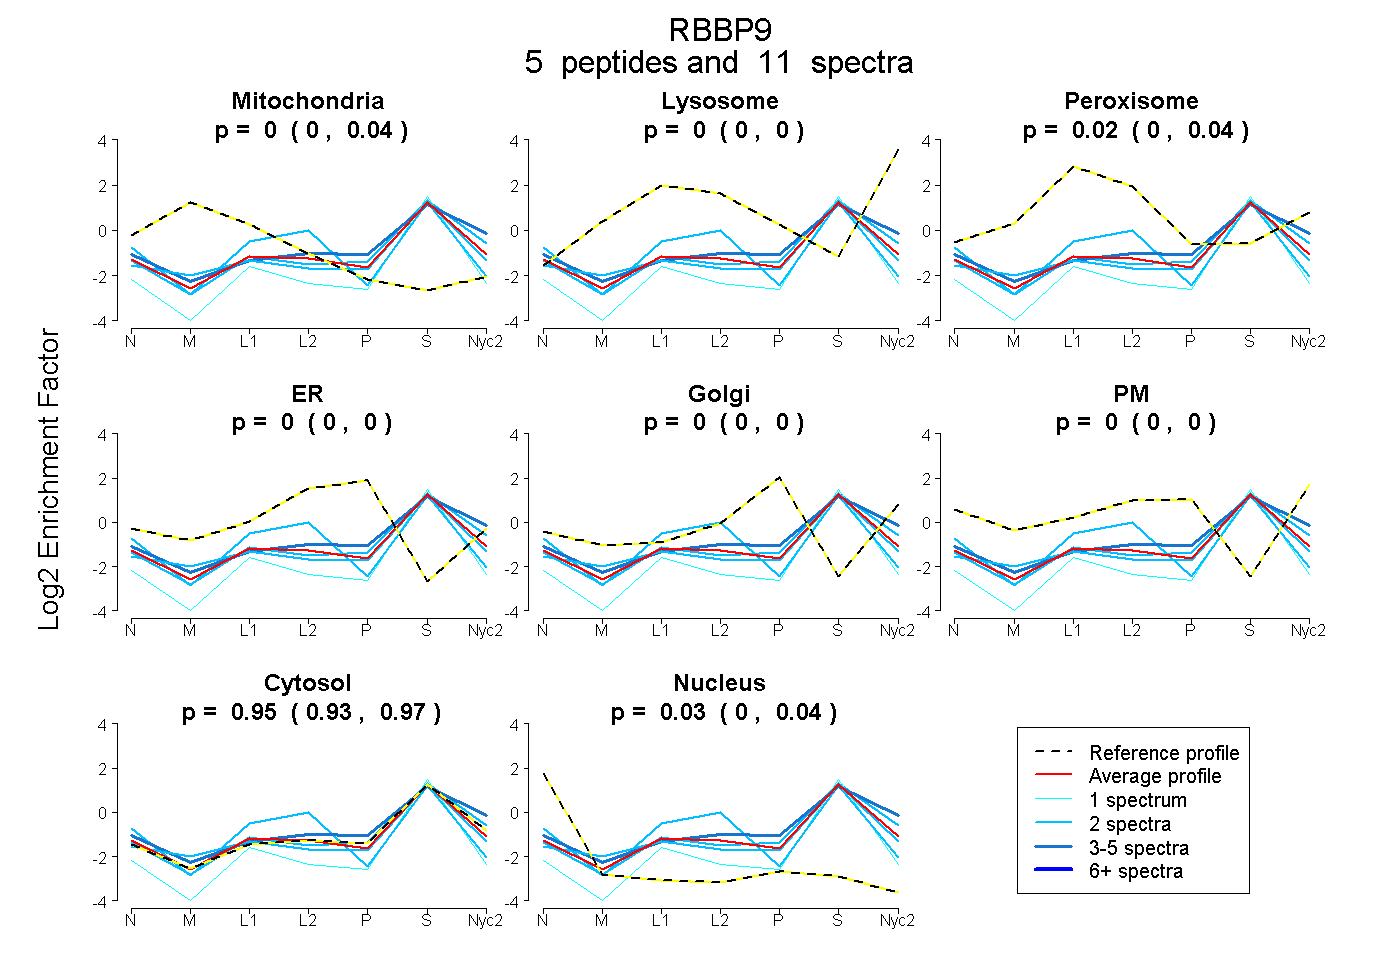
0.000 | 0.037
0.000 | 0.000
0.000 | 0.039
0.000 | 0.000
0.000 | 0.000
0.000 | 0.000
0.926 | 0.968
0.001 | 0.043
1peptide
spectra
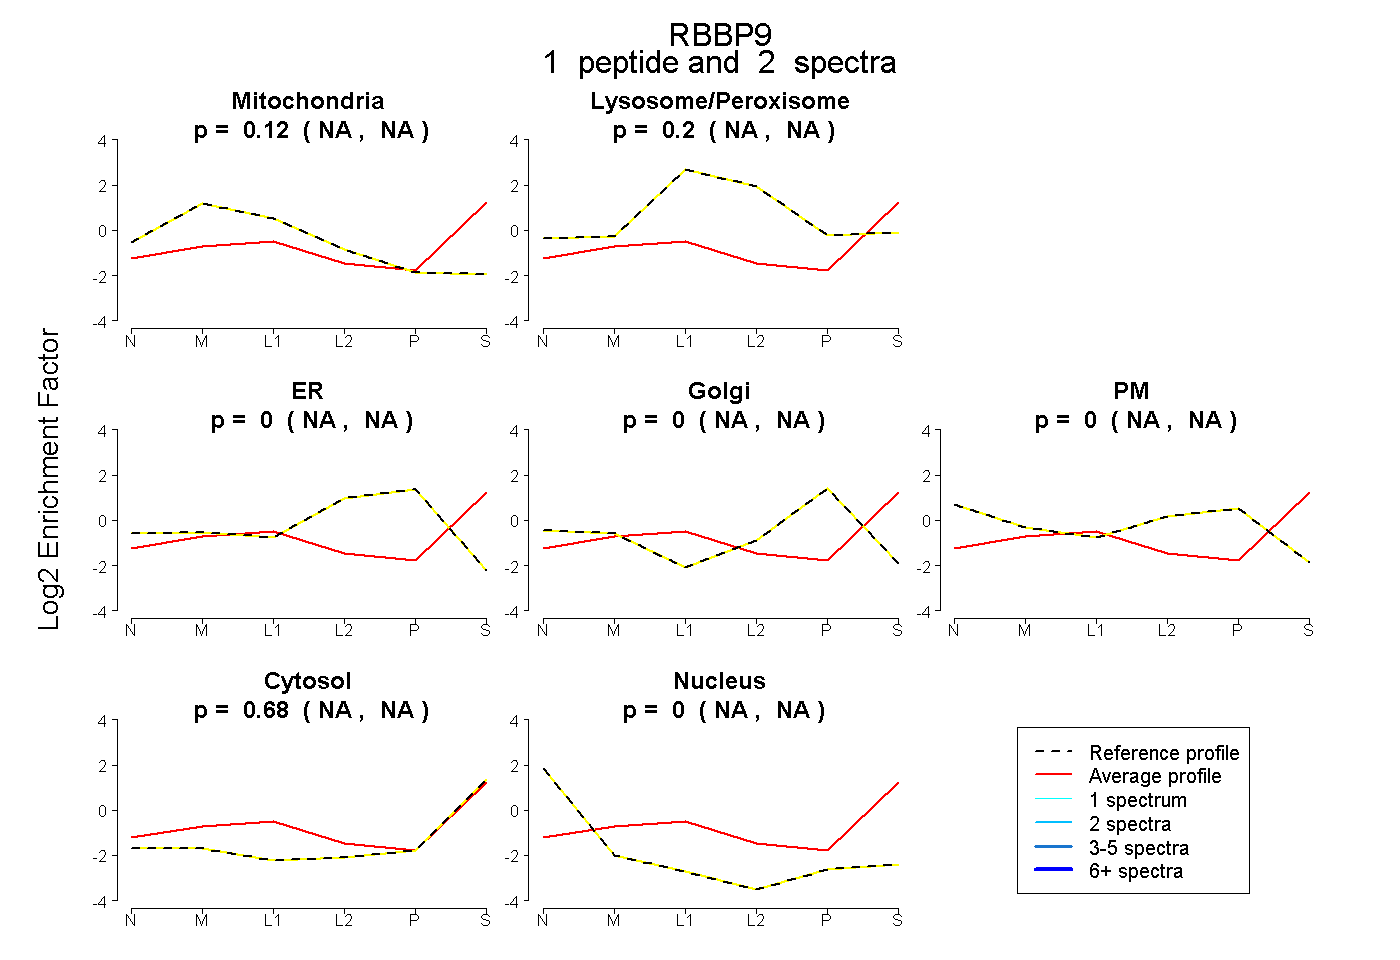
NA | NA
NA | NA
NA | NA
NA | NA
NA | NA
NA | NA
NA | NA
2peptides
spectra
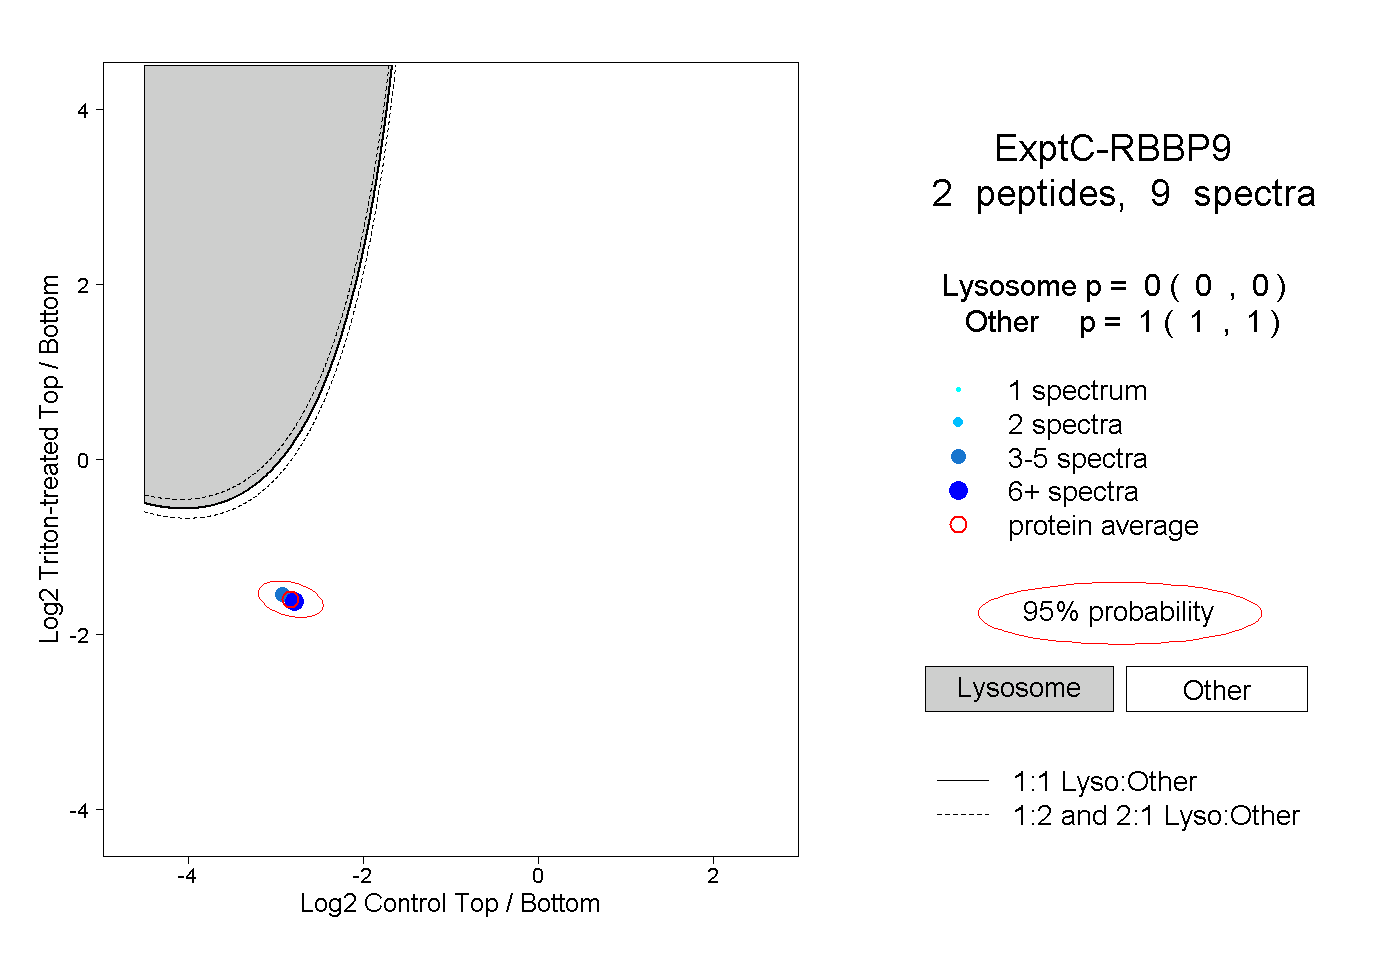
0.000 | 0.000
1.000 | 1.000