 5
5peptides
spectra
0.000 | 0.000
0.000 | 0.000
0.085 | 0.217
0.094 | 0.353
0.000 | 0.000
0.362 | 0.670
0.000 | 0.107
0.000 | 0.038
| Plot | Mito | Lyso | Perox | ER | Golgi | PM | Cytosol | Nucleus | |||||
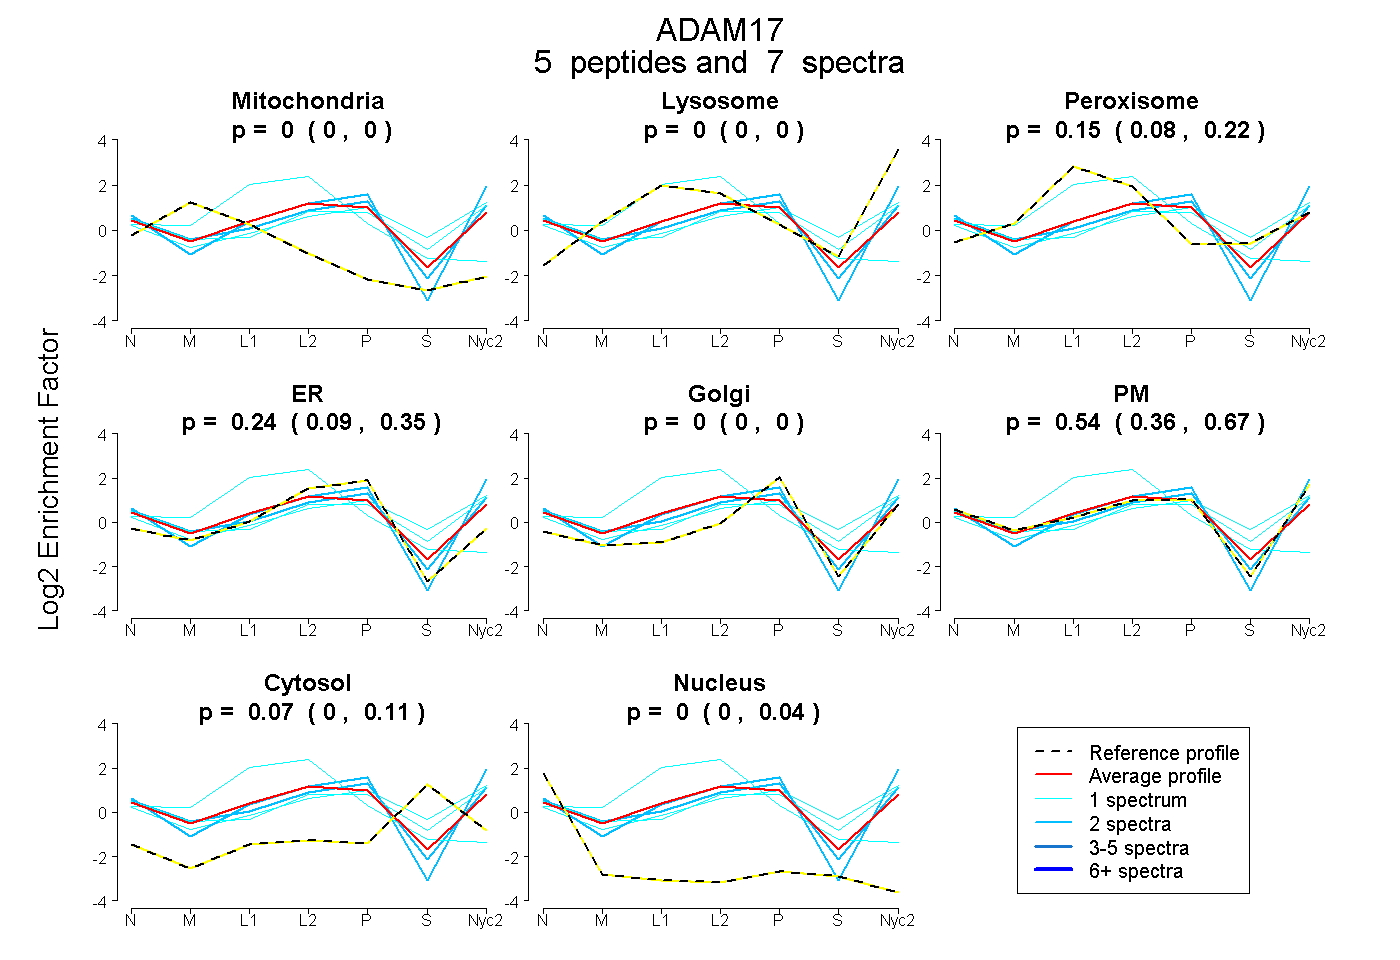
| Expt A |
5 peptides |
7 spectra |
|
0.000 0.000 | 0.000 |
0.000 0.000 | 0.000 |
0.148 0.085 | 0.217 |
0.242 0.094 | 0.353 |
0.000 0.000 | 0.000 |
0.538 0.362 | 0.670 |
0.072 0.000 | 0.107 |
0.000 0.000 | 0.038 |
| 1 spectrum, SPQEVKPGER | 0.103 | 0.000 | 0.556 | 0.342 | 0.000 | 0.000 | 0.000 | 0.000 | ||
| 1 spectrum, GYGVQIEQIR | 0.000 | 0.084 | 0.038 | 0.000 | 0.034 | 0.572 | 0.272 | 0.000 | ||
| 2 spectra, IIKPFPAPQTPGR | 0.000 | 0.000 | 0.000 | 0.067 | 0.015 | 0.918 | 0.000 | 0.000 | ||
| 2 spectra, ANSHGGVCPK | 0.000 | 0.000 | 0.000 | 0.176 | 0.031 | 0.751 | 0.041 | 0.002 | ||
| 1 spectrum, MLLEQFSLDIAEEASK | 0.000 | 0.000 | 0.055 | 0.000 | 0.000 | 0.732 | 0.213 | 0.000 |
| Plot | Mito | Lyso or Perox | ER | Golgi | PM | Cytosol | Nucleus | ||||||
| Expt B |
1 peptide |
1 spectrum |
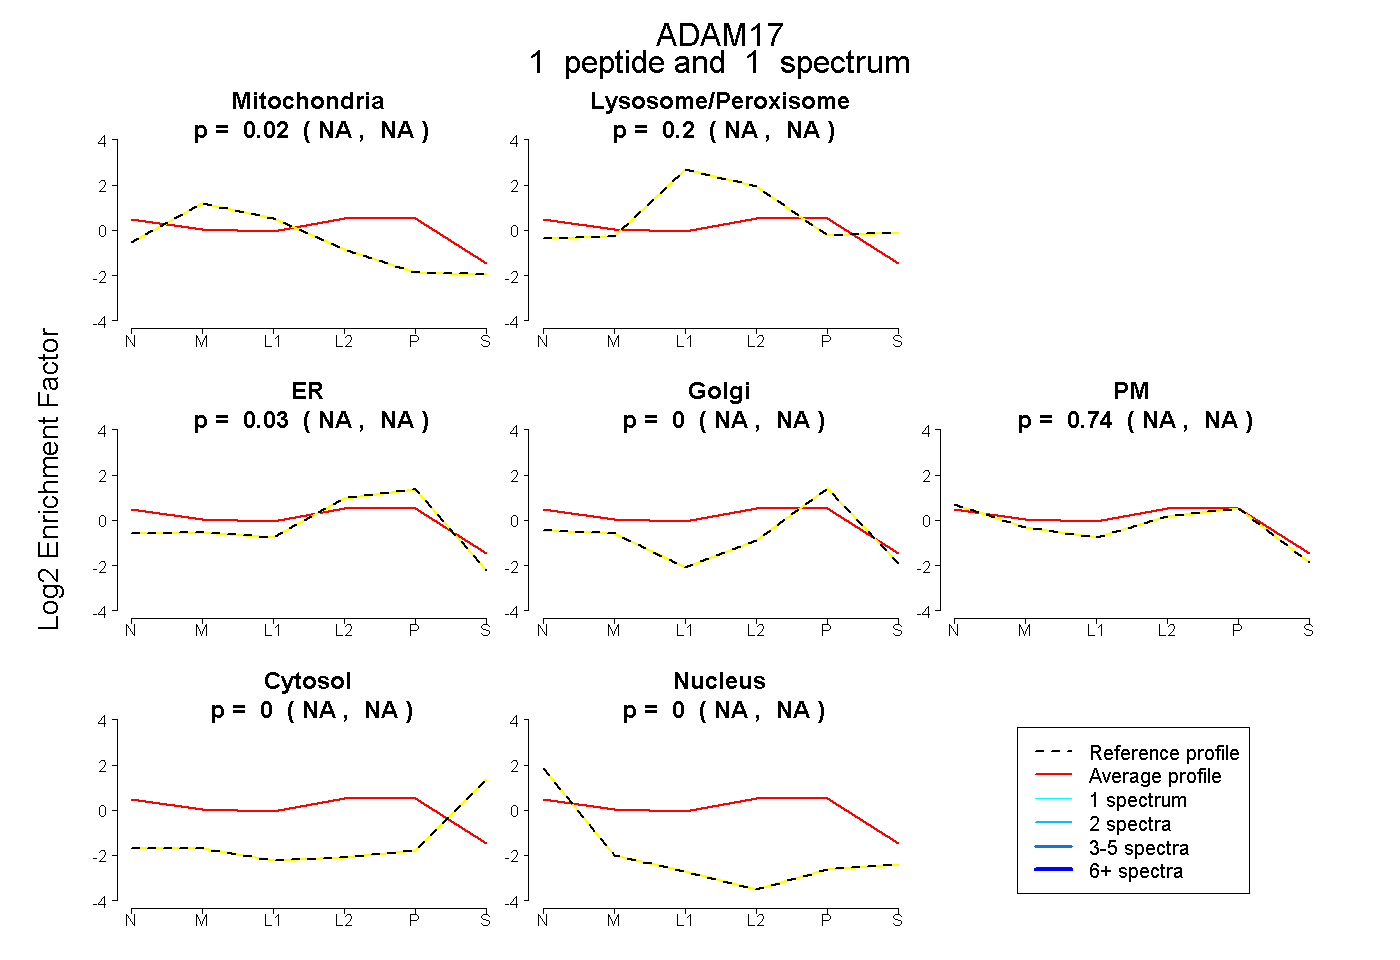 |
0.023 NA | NA |
0.202 NA | NA |
0.030 NA | NA |
0.003 NA | NA |
0.743 NA | NA |
0.000 NA | NA |
0.000 NA | NA |
|||
| Plot | Lyso | Other | |||||||||||
| Expt C |
6 peptides |
16 spectra |
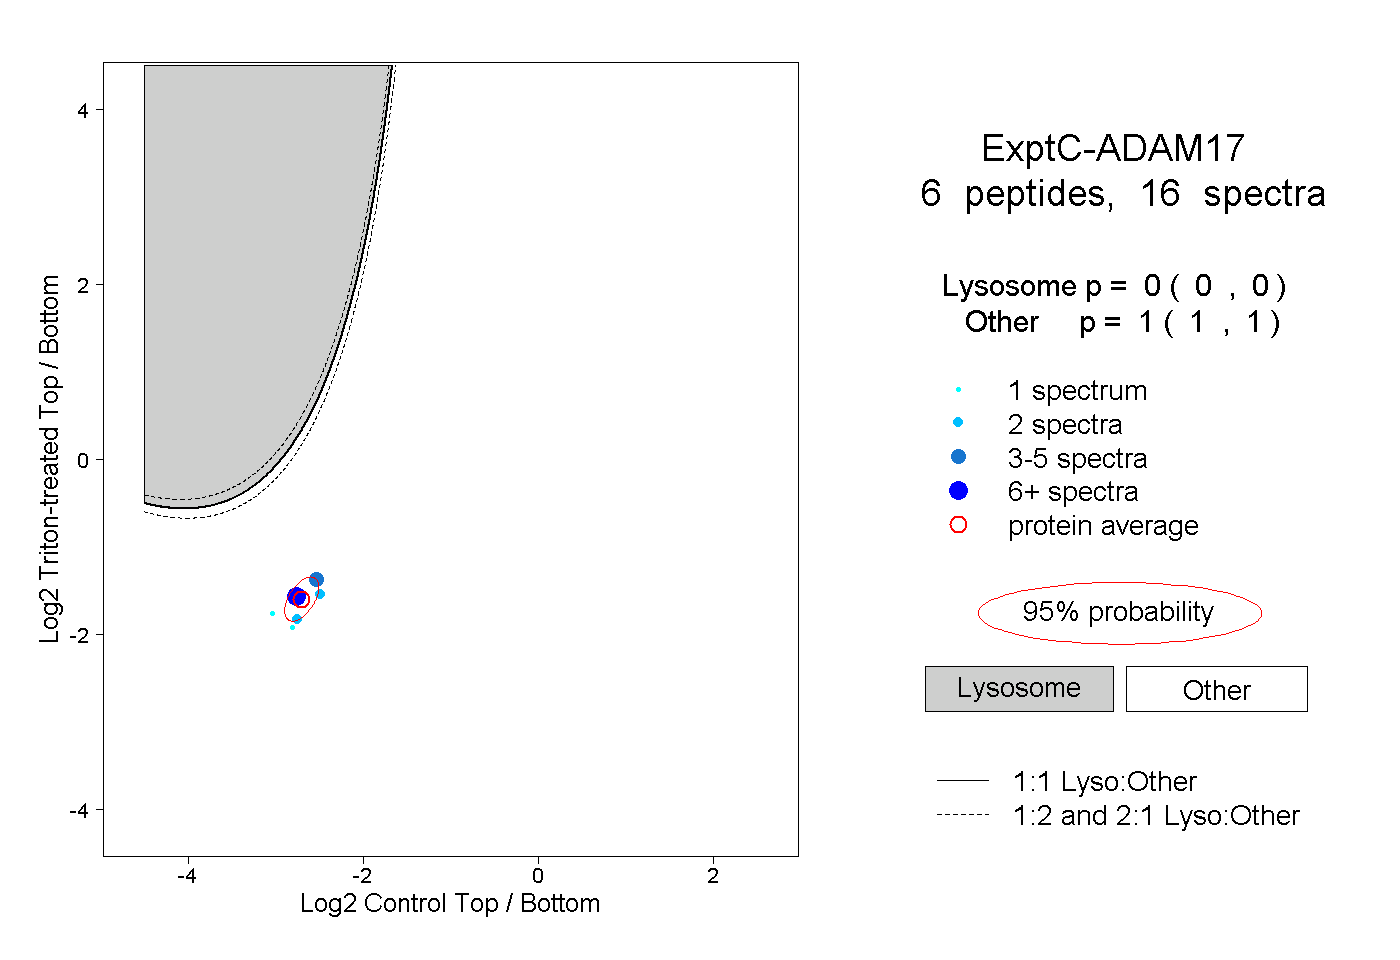 |
0.000 0.000 | 0.000 |
1.000 1.000 | 1.000 |