 5
5peptides
spectra
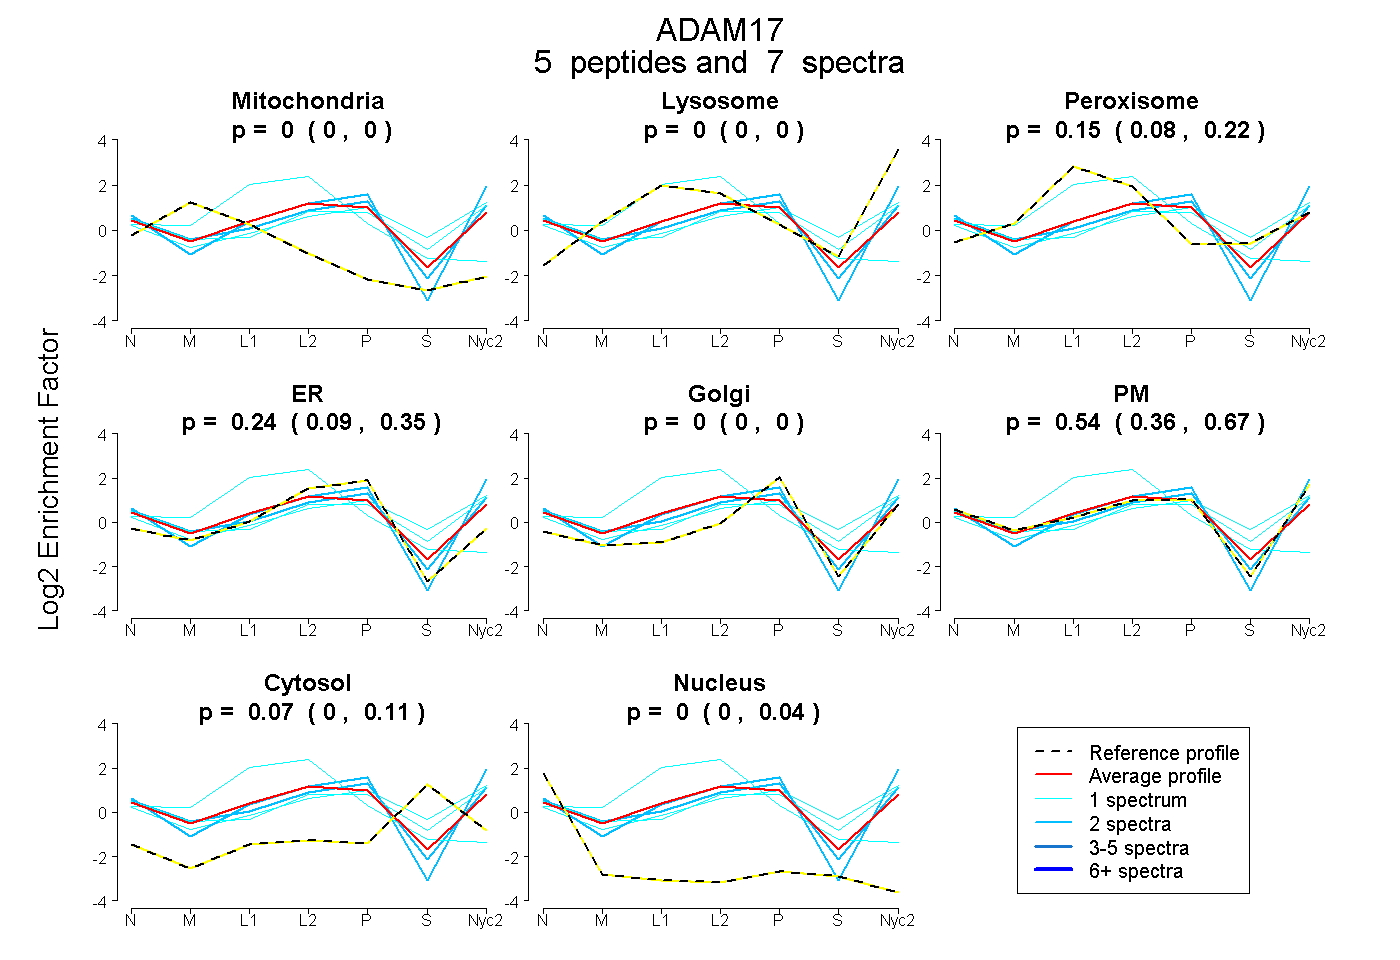
0.000 | 0.000
0.000 | 0.000
0.085 | 0.217
0.094 | 0.353
0.000 | 0.000
0.362 | 0.670
0.000 | 0.107
0.000 | 0.038
1peptide
spectrum
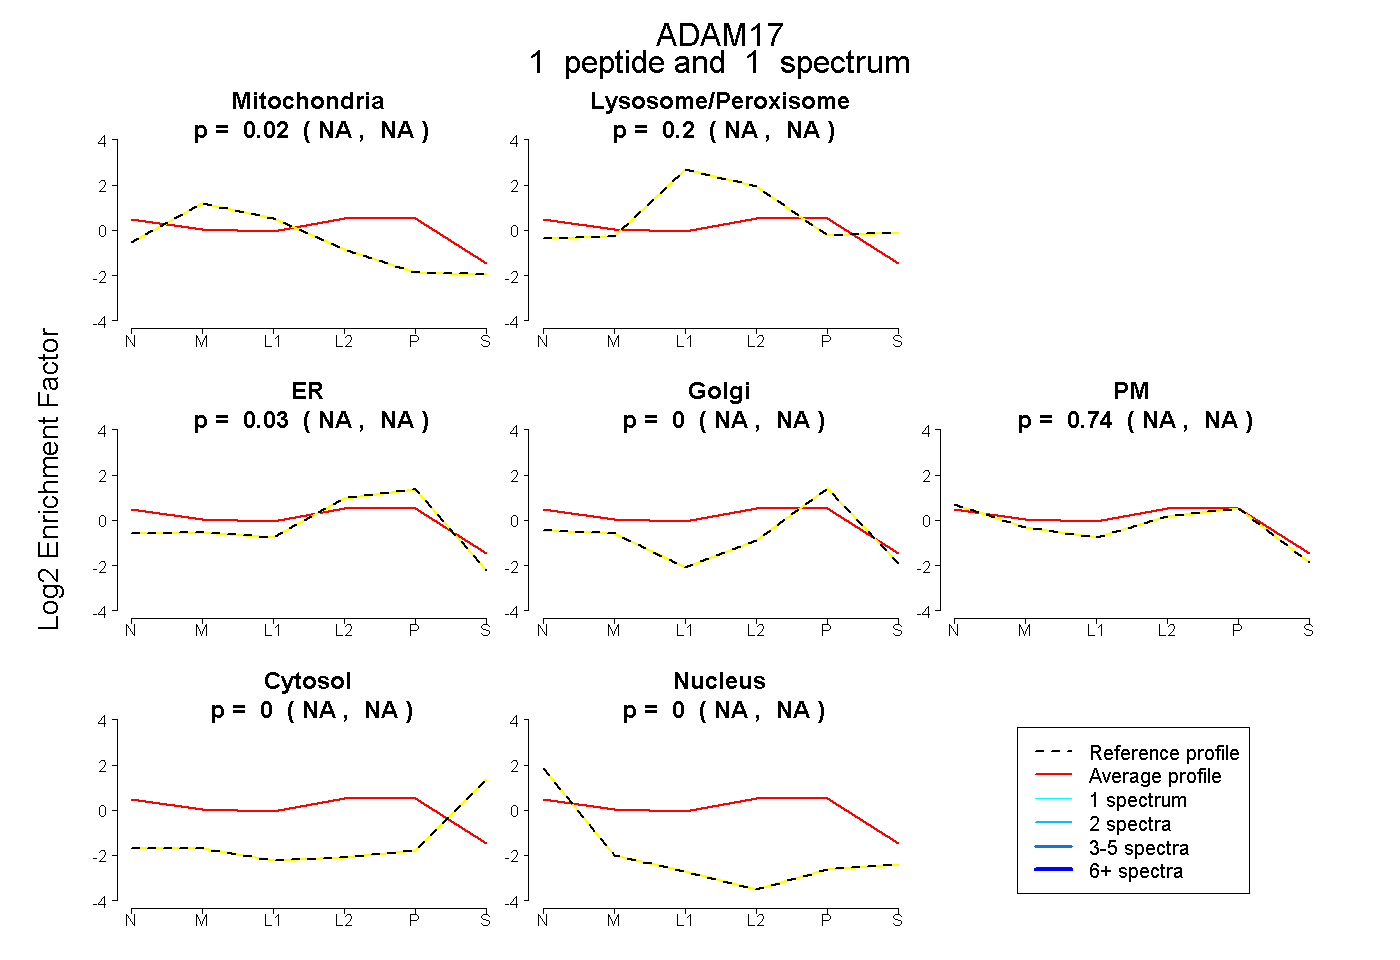
NA | NA
NA | NA
NA | NA
NA | NA
NA | NA
NA | NA
NA | NA
6peptides
spectra
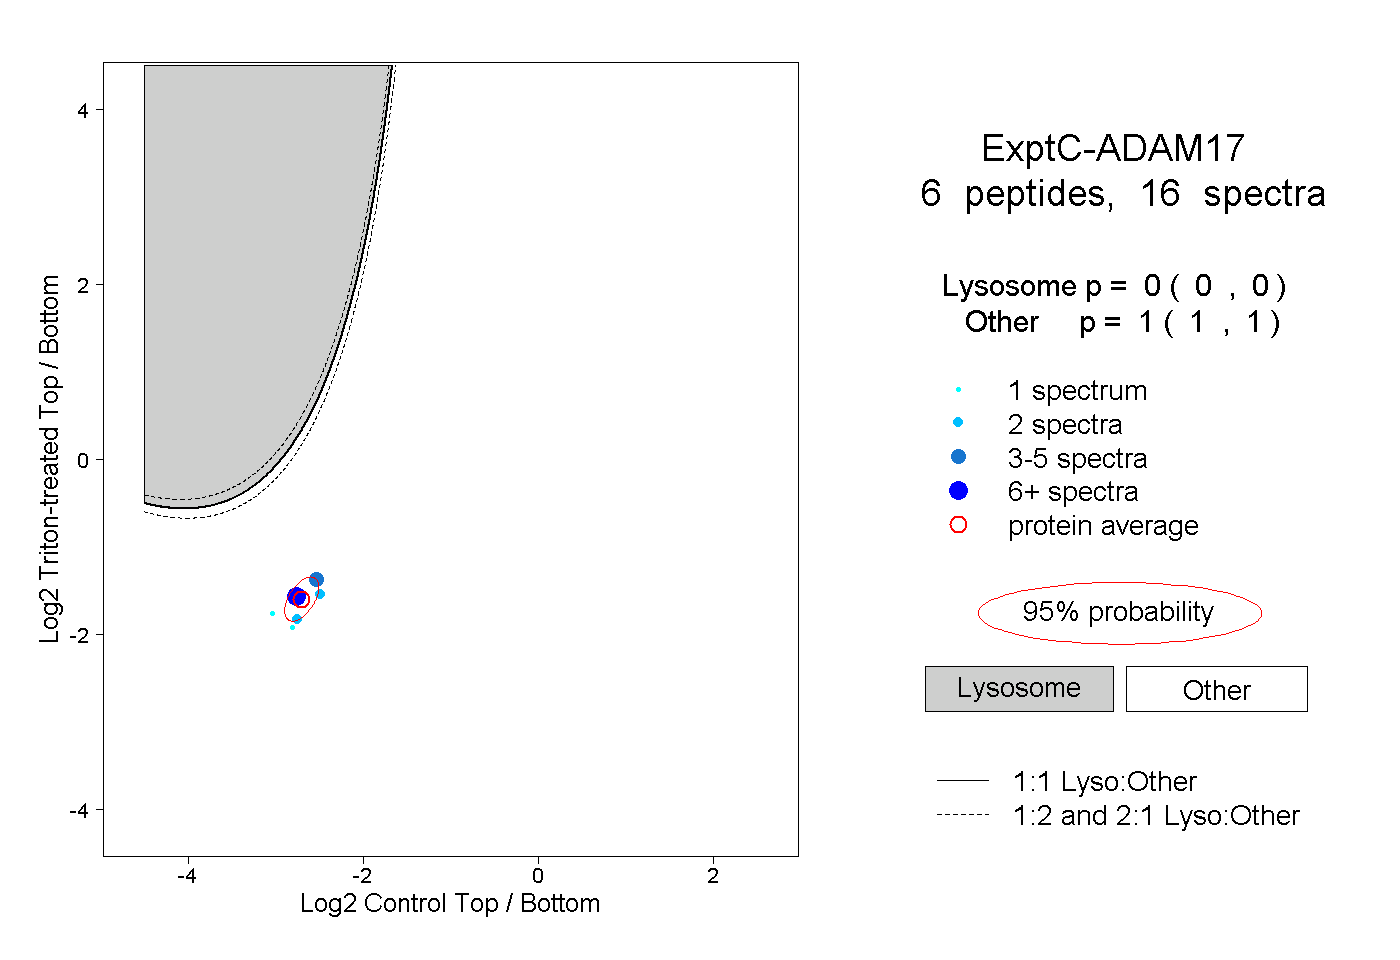
0.000 | 0.000
1.000 | 1.000