 4
4peptides
spectra
0.000 | 0.000
0.000 | 0.000
0.000 | 0.000
0.643 | 0.790
0.132 | 0.311
0.000 | 0.000
0.000 | 0.049
0.000 | 0.056
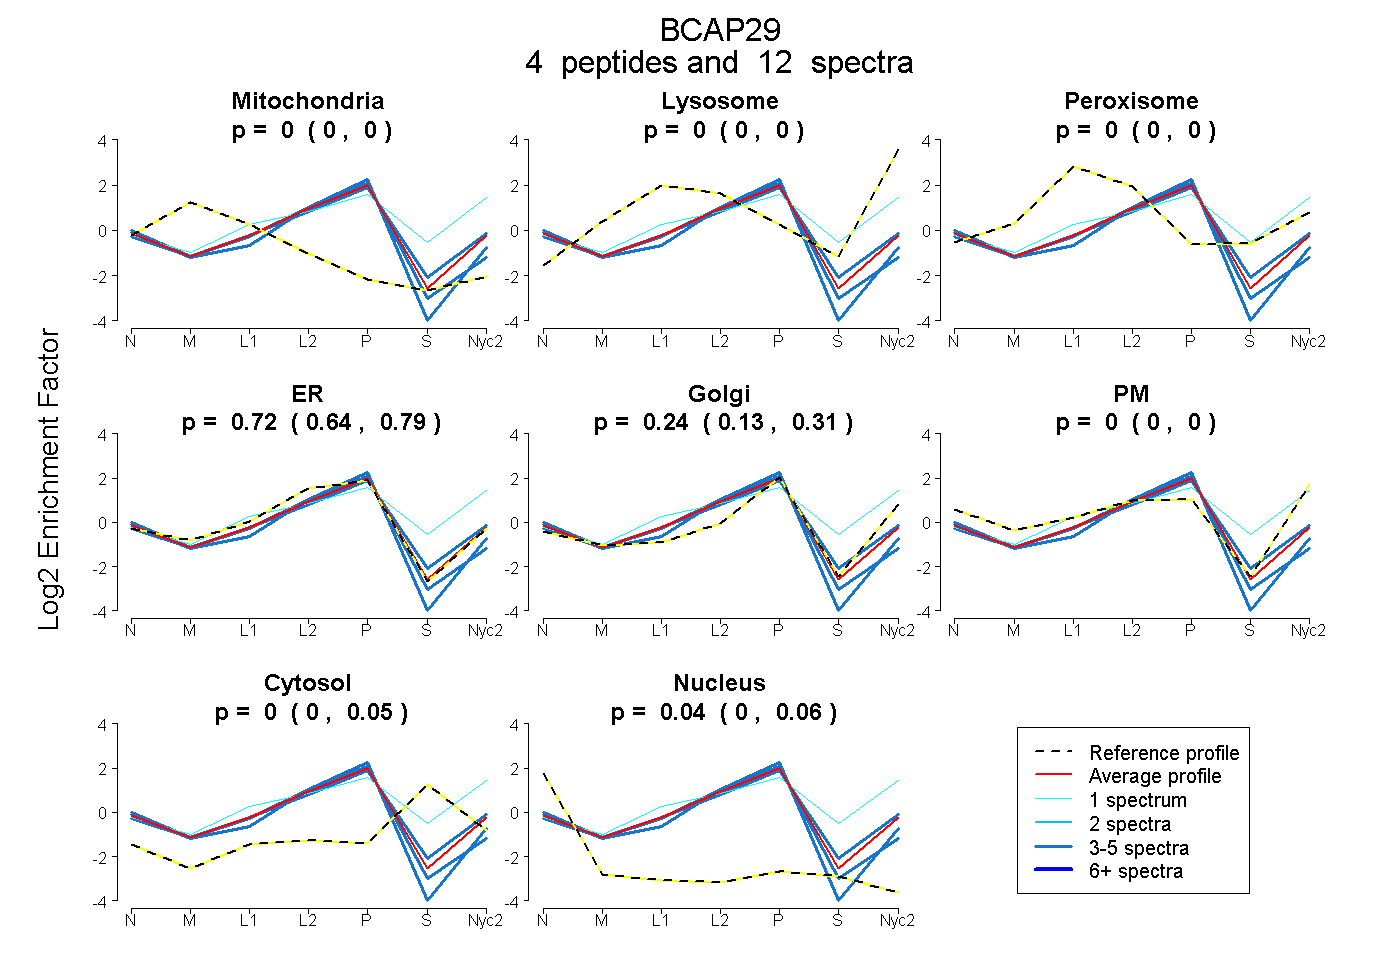
| Plot | Mito | Lyso | Perox | ER | Golgi | PM | Cytosol | Nucleus | |||||
| Expt A |
4 peptides |
12 spectra |
|
0.000 0.000 | 0.000 |
0.000 0.000 | 0.000 |
0.000 0.000 | 0.000 |
0.723 0.643 | 0.790 |
0.239 0.132 | 0.311 |
0.000 0.000 | 0.000 |
0.000 0.000 | 0.049 |
0.038 0.000 | 0.056 |
| 4 spectra, FMEENER | 0.000 | 0.000 | 0.000 | 0.926 | 0.014 | 0.000 | 0.000 | 0.059 | ||
| 3 spectra, ASDALFK | 0.000 | 0.000 | 0.000 | 0.649 | 0.264 | 0.009 | 0.065 | 0.013 | ||
| 1 spectrum, NSASRPAAYEQAQMR | 0.000 | 0.251 | 0.062 | 0.077 | 0.329 | 0.132 | 0.150 | 0.000 | ||
| 4 spectra, EHSELQNR | 0.000 | 0.000 | 0.000 | 0.887 | 0.000 | 0.000 | 0.000 | 0.113 |
| Plot | Mito | Lyso or Perox | ER | Golgi | PM | Cytosol | Nucleus | ||||||
| Expt B |
1 peptide |
2 spectra |
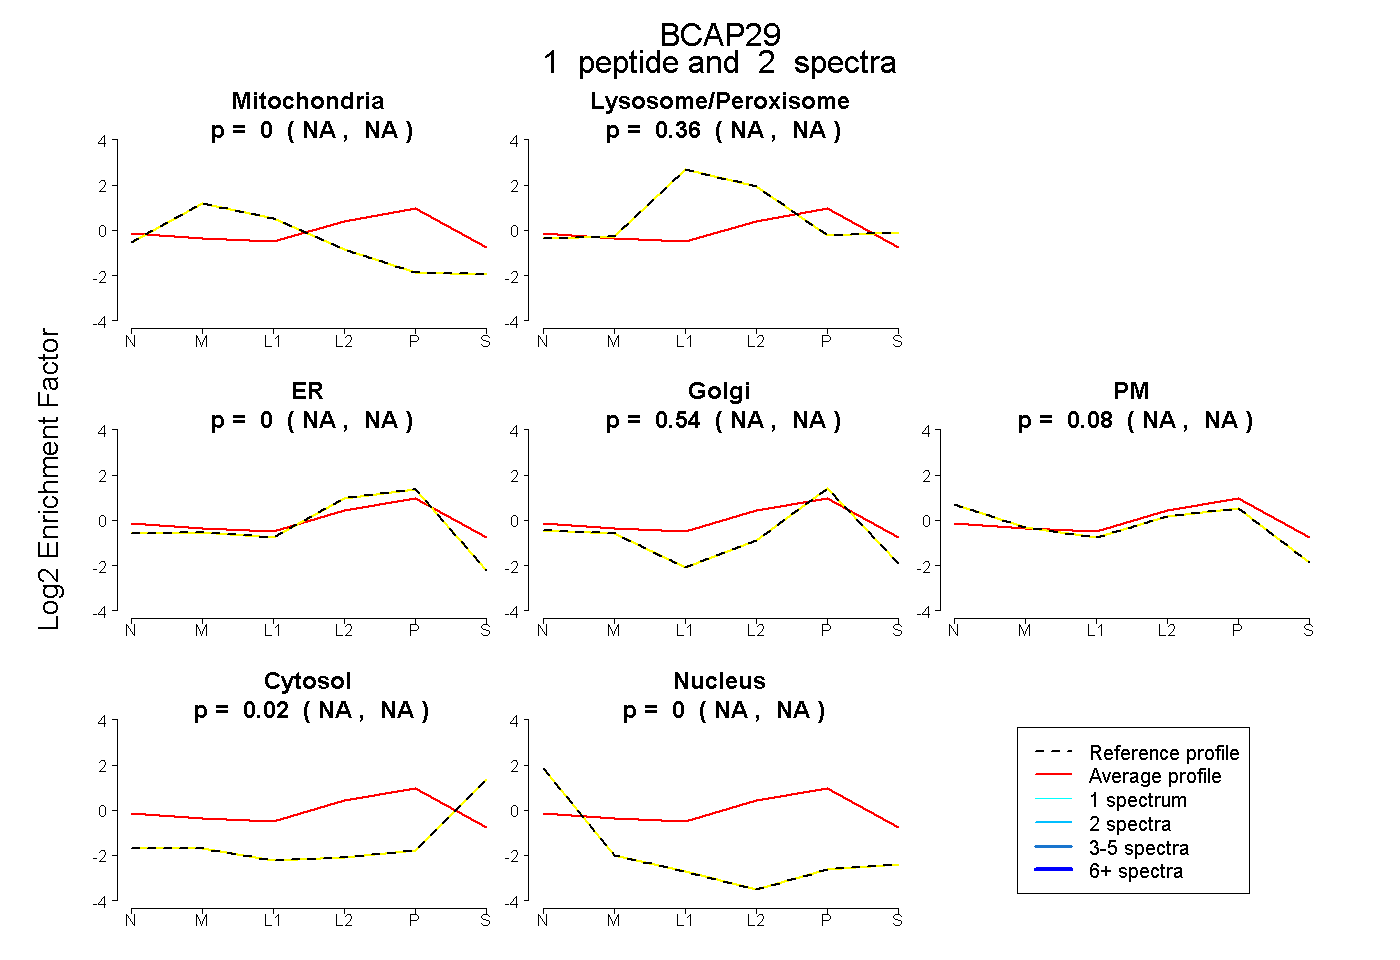 |
0.000 NA | NA |
0.361 NA | NA |
0.000 NA | NA |
0.544 NA | NA |
0.076 NA | NA |
0.020 NA | NA |
0.000 NA | NA |
|||
| Plot | Lyso | Other | |||||||||||
| Expt C |
7 peptides |
15 spectra |
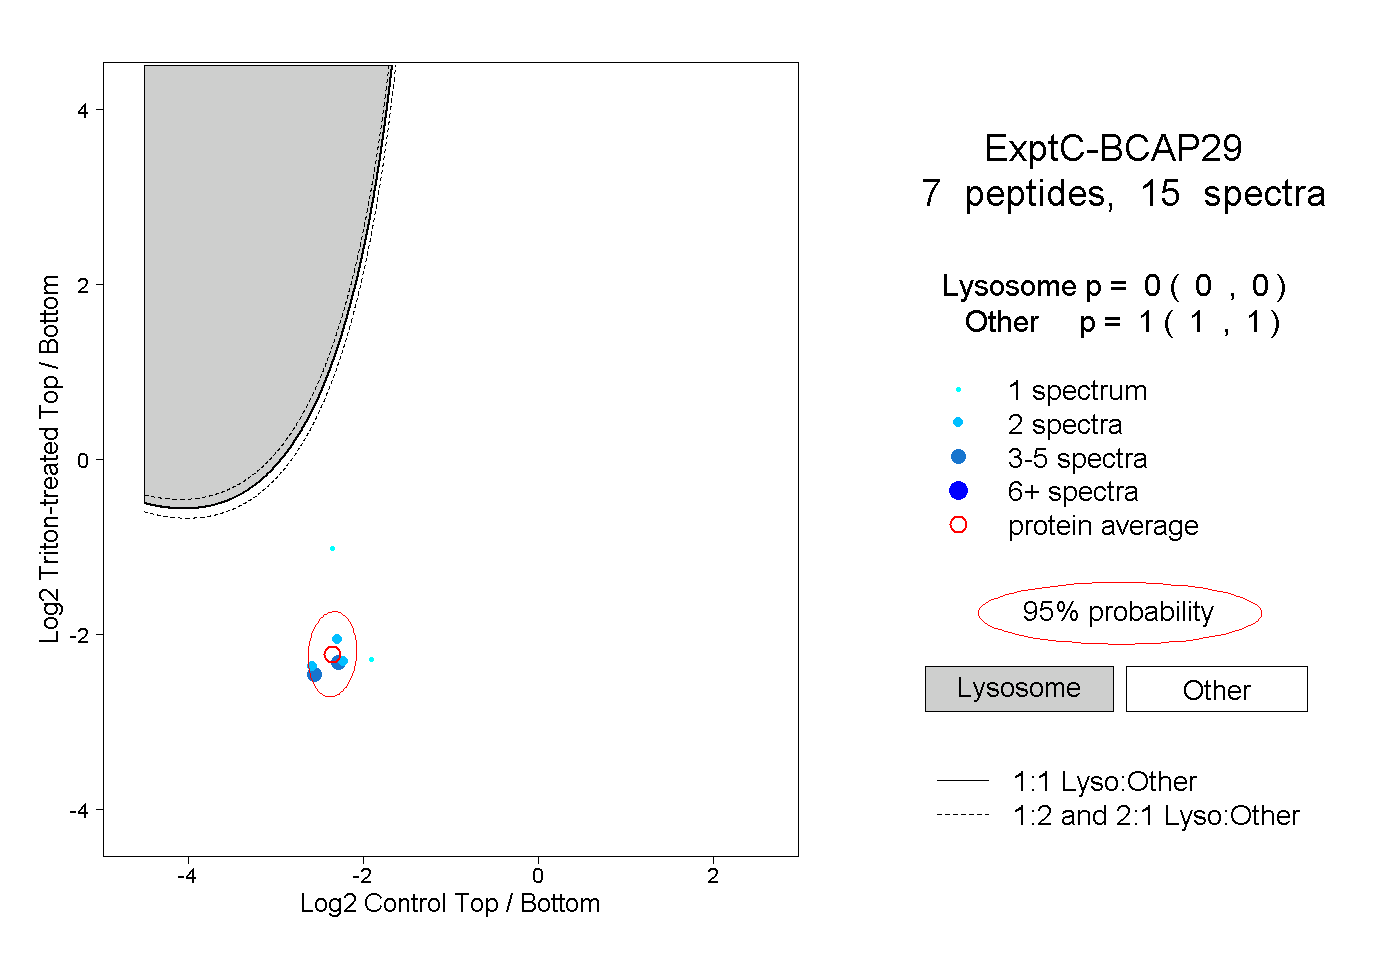 |
0.000 0.000 | 0.000 |
1.000 1.000 | 1.000 |
||||||||
| Plot | Lyso | Other | |||||||||||
| Expt D |
2 peptides |
2 spectra |
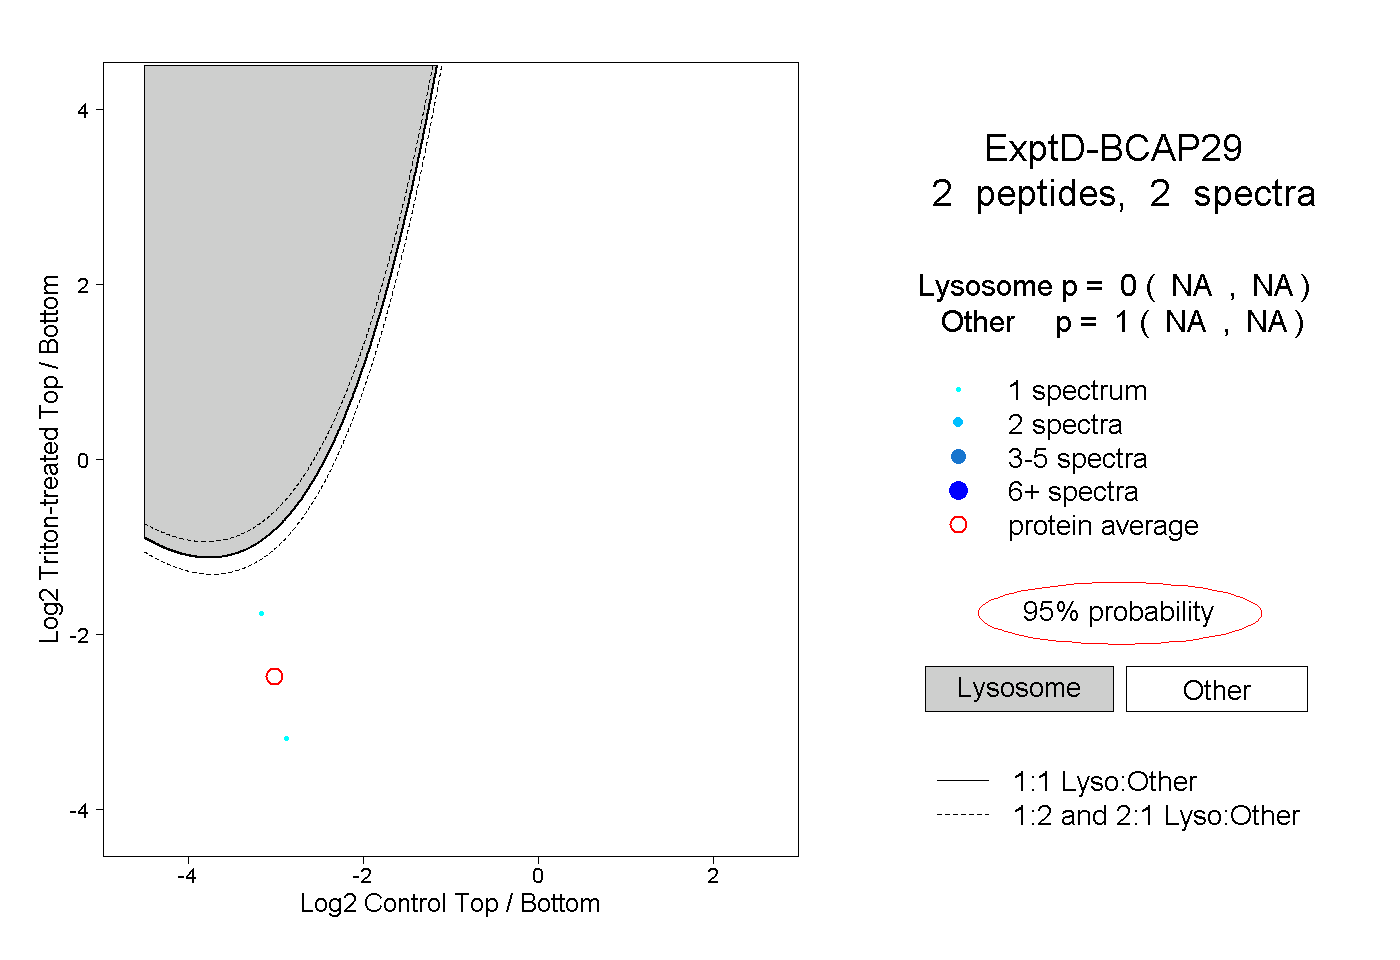 |
0.000 NA | NA |
1.000 NA | NA |