 4
4peptides
spectra
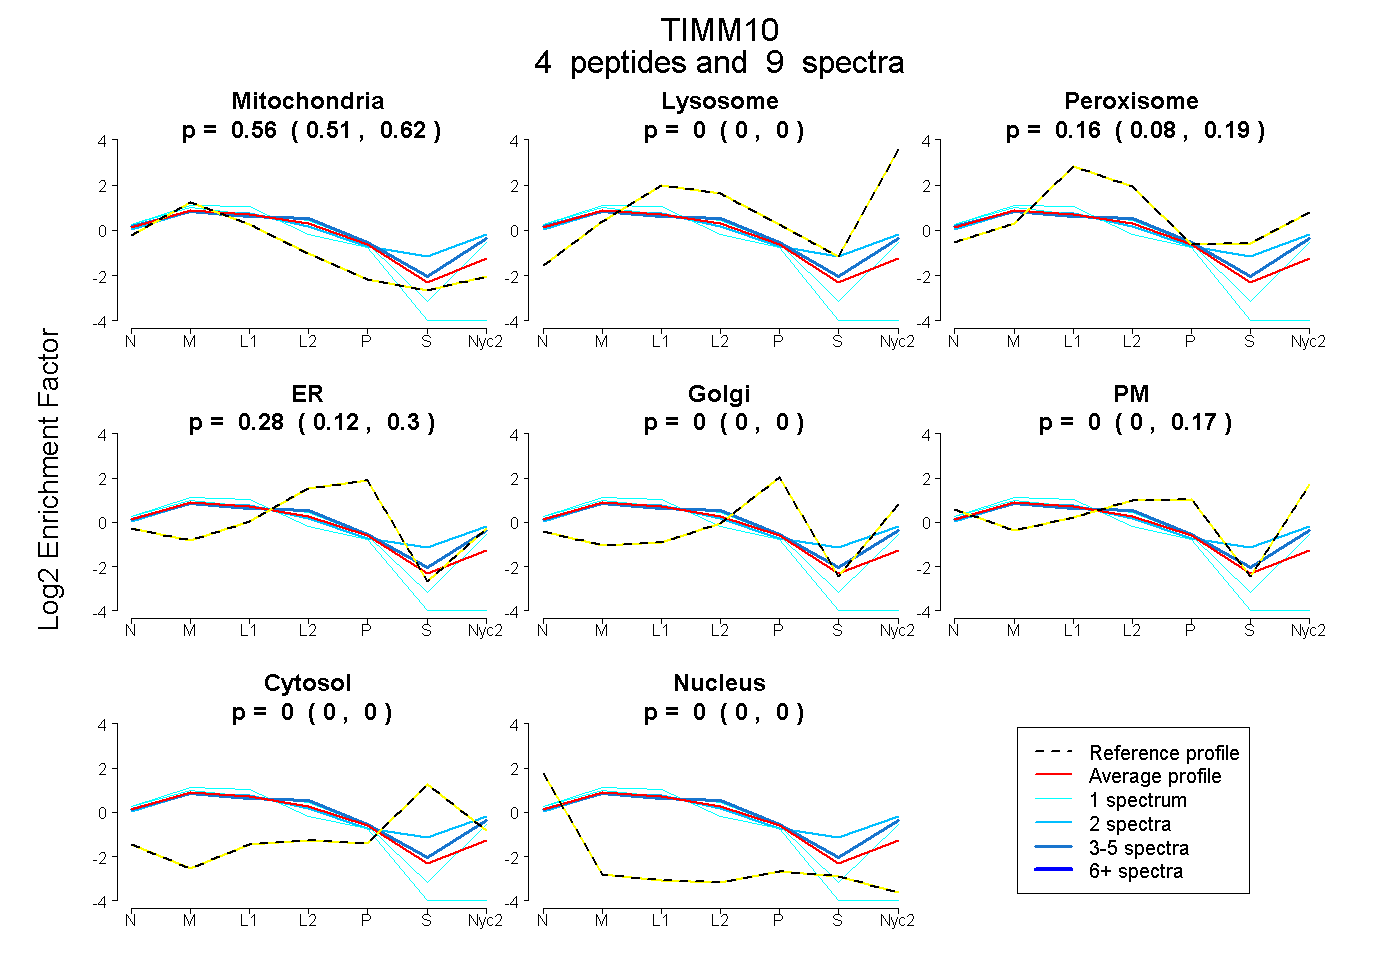
0.511 | 0.617
0.000 | 0.000
0.084 | 0.194
0.115 | 0.300
0.000 | 0.000
0.000 | 0.169
0.000 | 0.000
0.000 | 0.000
1peptide
spectra
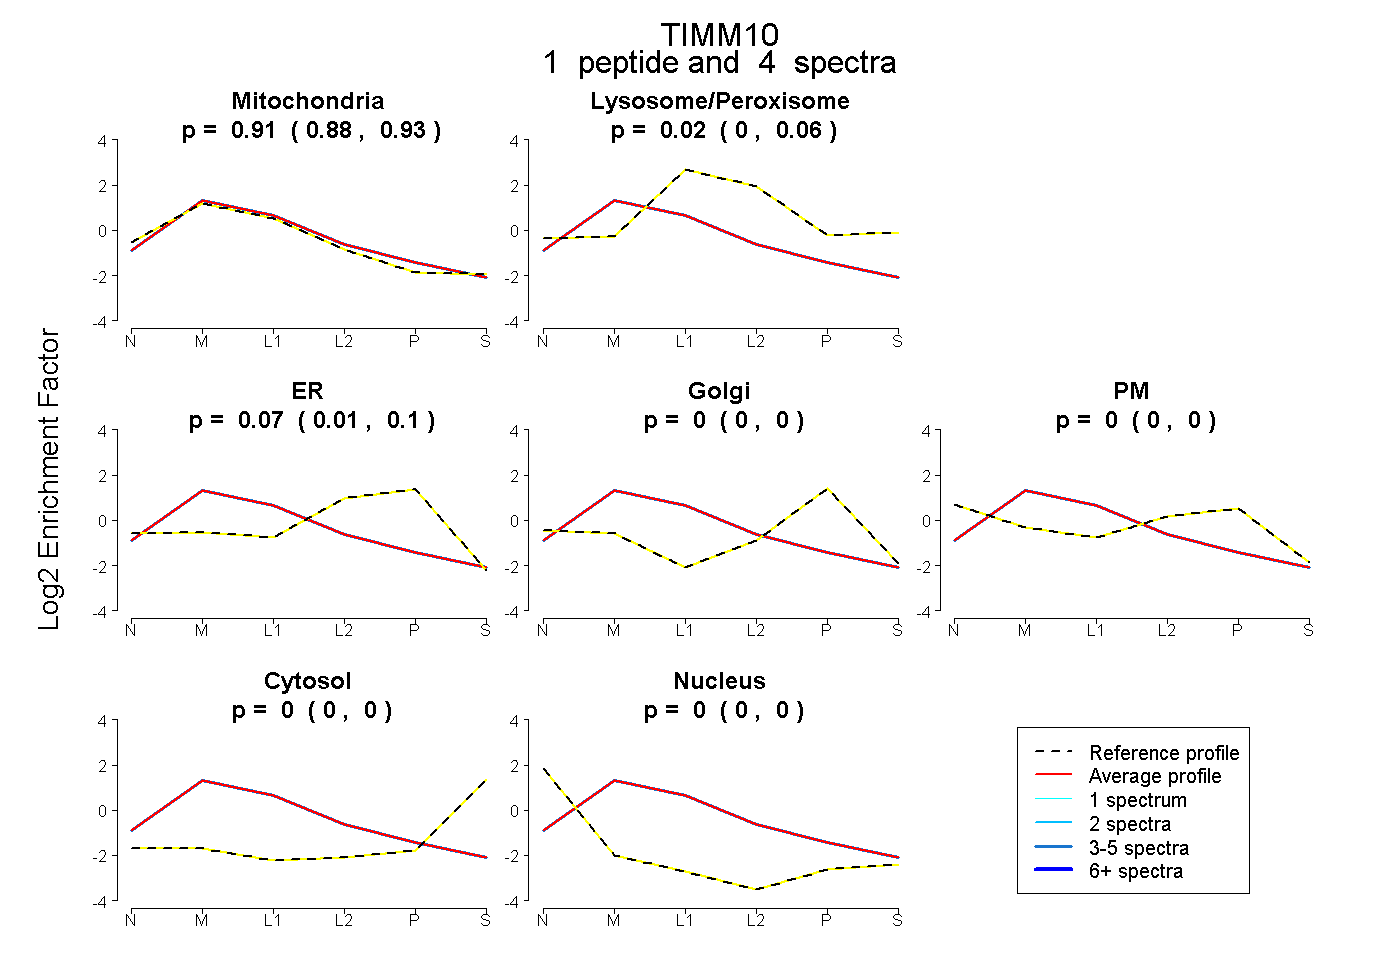
0.879 | 0.931
0.000 | 0.060
0.012 | 0.097
0.000 | 0.000
0.000 | 0.000
0.000 | 0.000
0.000 | 0.000
4peptides
spectra
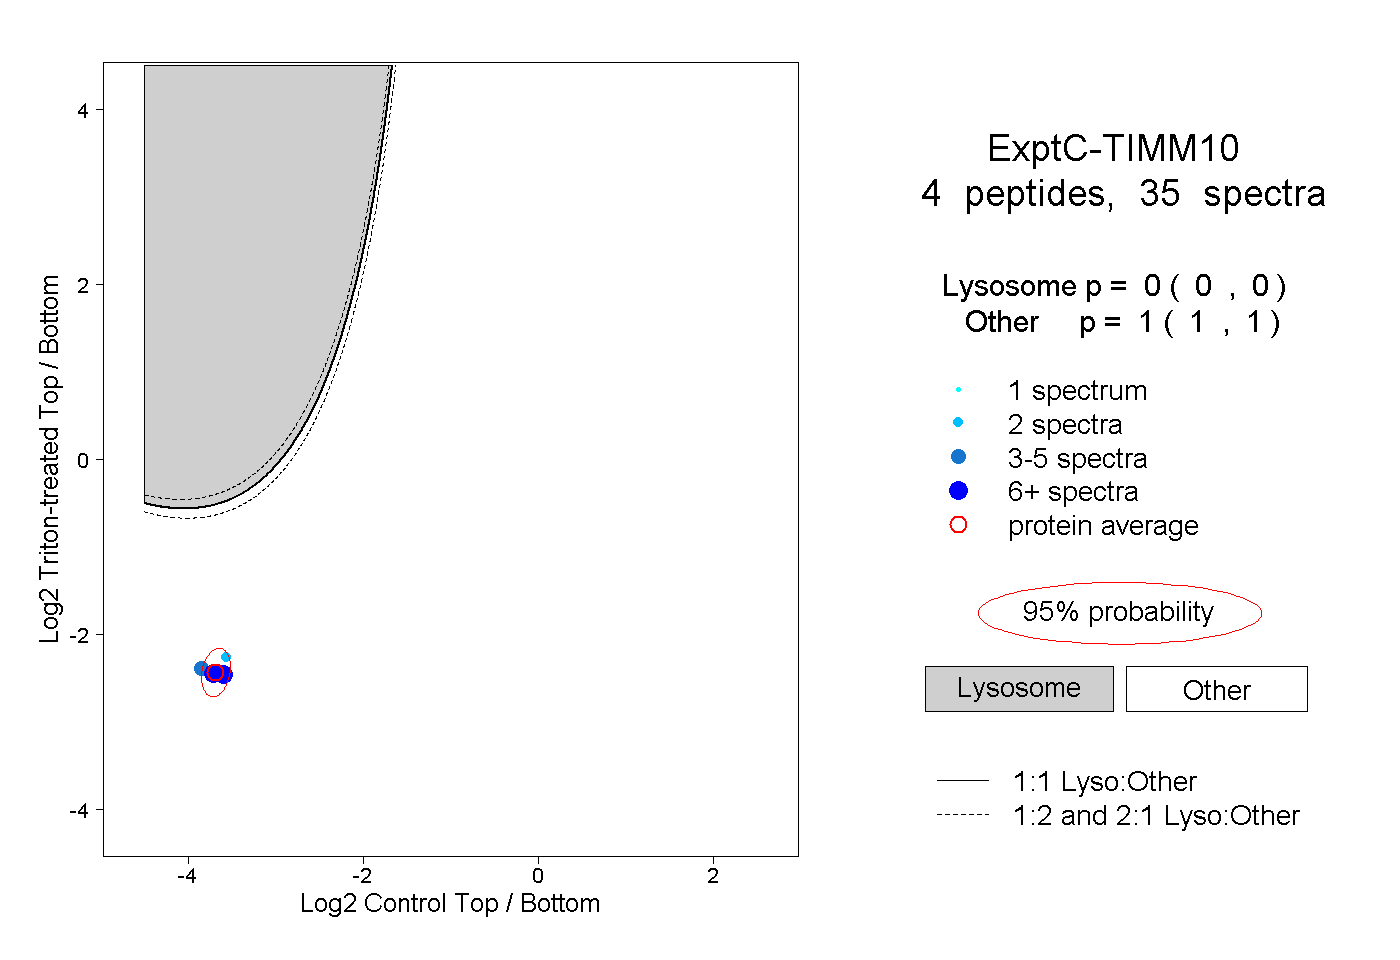
0.000 | 0.000
1.000 | 1.000
2peptides
spectra
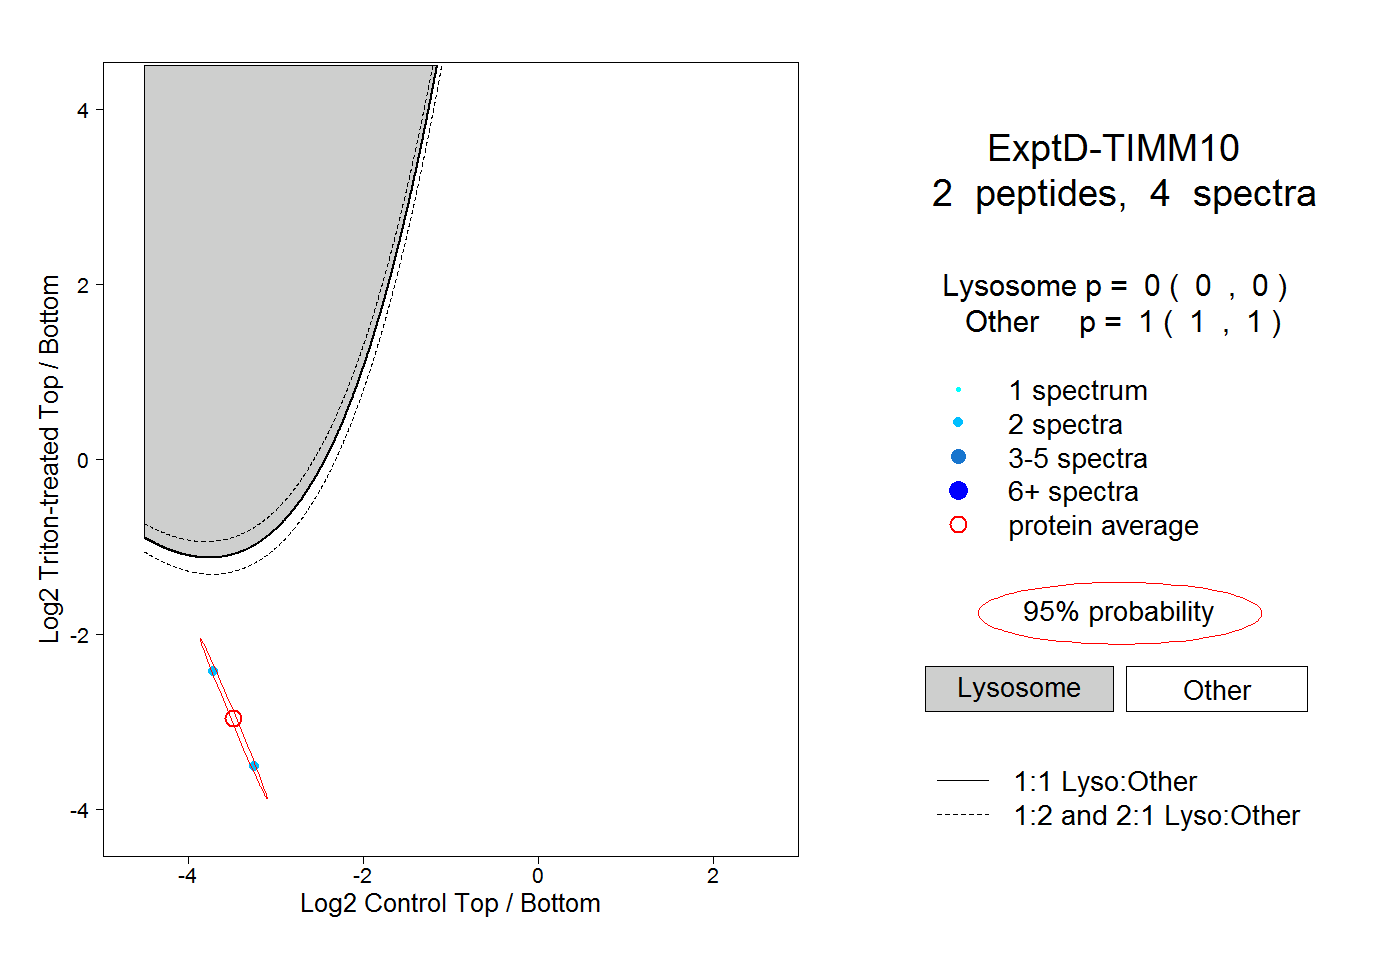
0.000 | 0.000
1.000 | 1.000