 4
4peptides
spectra
0.511 | 0.617
0.000 | 0.000
0.084 | 0.194
0.115 | 0.300
0.000 | 0.000
0.000 | 0.169
0.000 | 0.000
0.000 | 0.000
| Plot | Mito | Lyso | Perox | ER | Golgi | PM | Cytosol | Nucleus | |||||
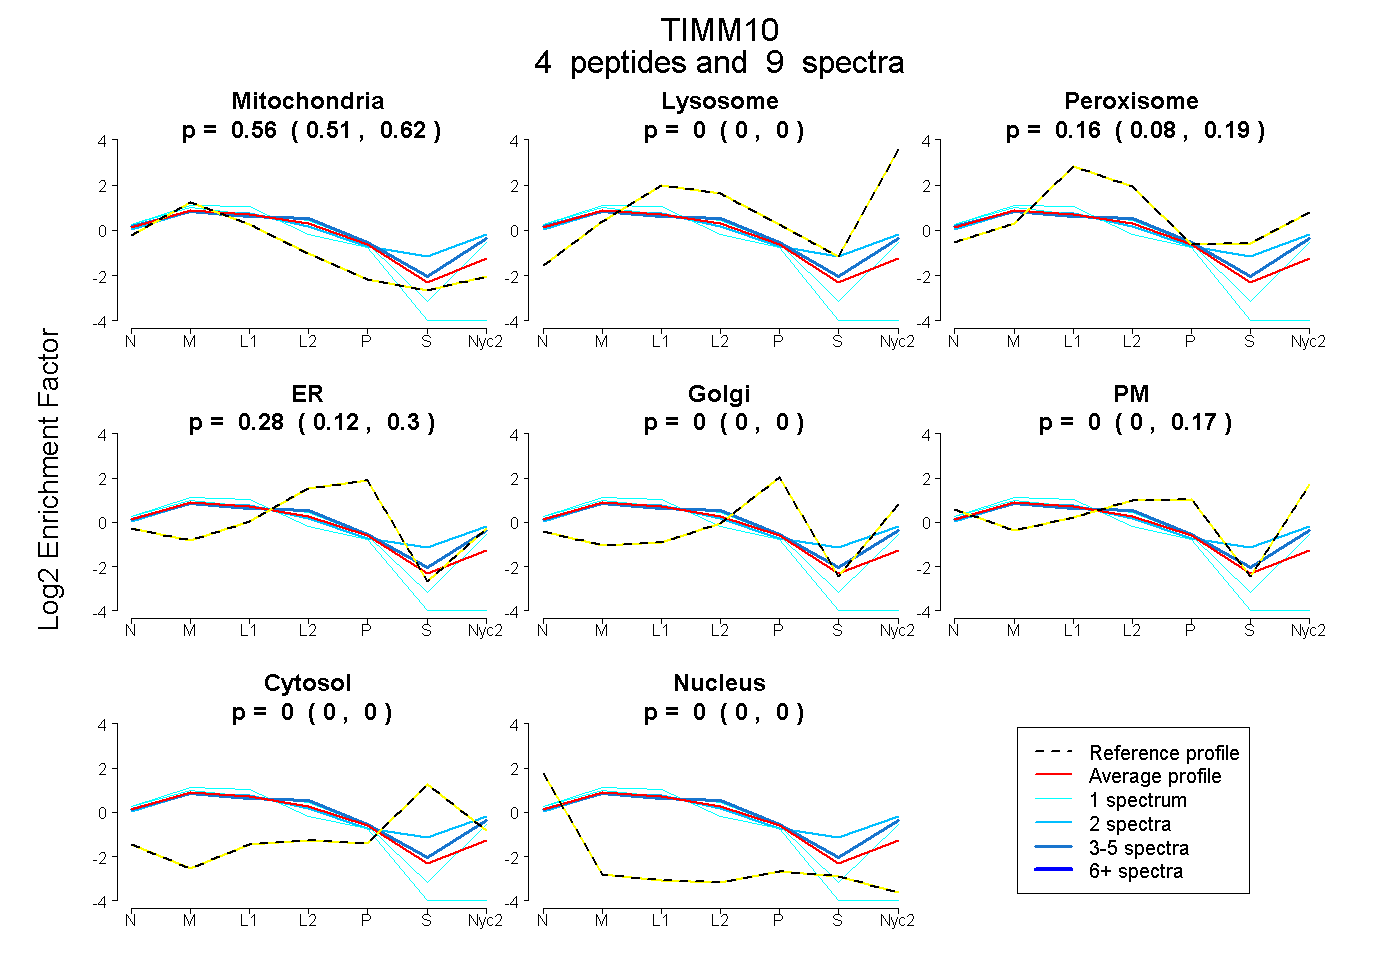
| Expt A |
4 peptides |
9 spectra |
|
0.564 0.511 | 0.617 |
0.000 0.000 | 0.000 |
0.156 0.084 | 0.194 |
0.275 0.115 | 0.300 |
0.000 0.000 | 0.000 |
0.004 0.000 | 0.169 |
0.000 0.000 | 0.000 |
0.000 0.000 | 0.000 |
| 5 spectra, YLDIHER | 0.443 | 0.000 | 0.205 | 0.069 | 0.000 | 0.283 | 0.000 | 0.000 | ||
| 1 spectrum, VQQSSGPA | 0.519 | 0.000 | 0.056 | 0.097 | 0.000 | 0.328 | 0.000 | 0.000 | ||
| 2 spectra, GESVCLDR | 0.389 | 0.000 | 0.320 | 0.000 | 0.000 | 0.210 | 0.081 | 0.000 | ||
| 1 spectrum, LTELSMQDEELMK | 0.845 | 0.000 | 0.000 | 0.153 | 0.000 | 0.000 | 0.000 | 0.002 |
| Plot | Mito | Lyso or Perox | ER | Golgi | PM | Cytosol | Nucleus | ||||||
| Expt B |
1 peptide |
4 spectra |
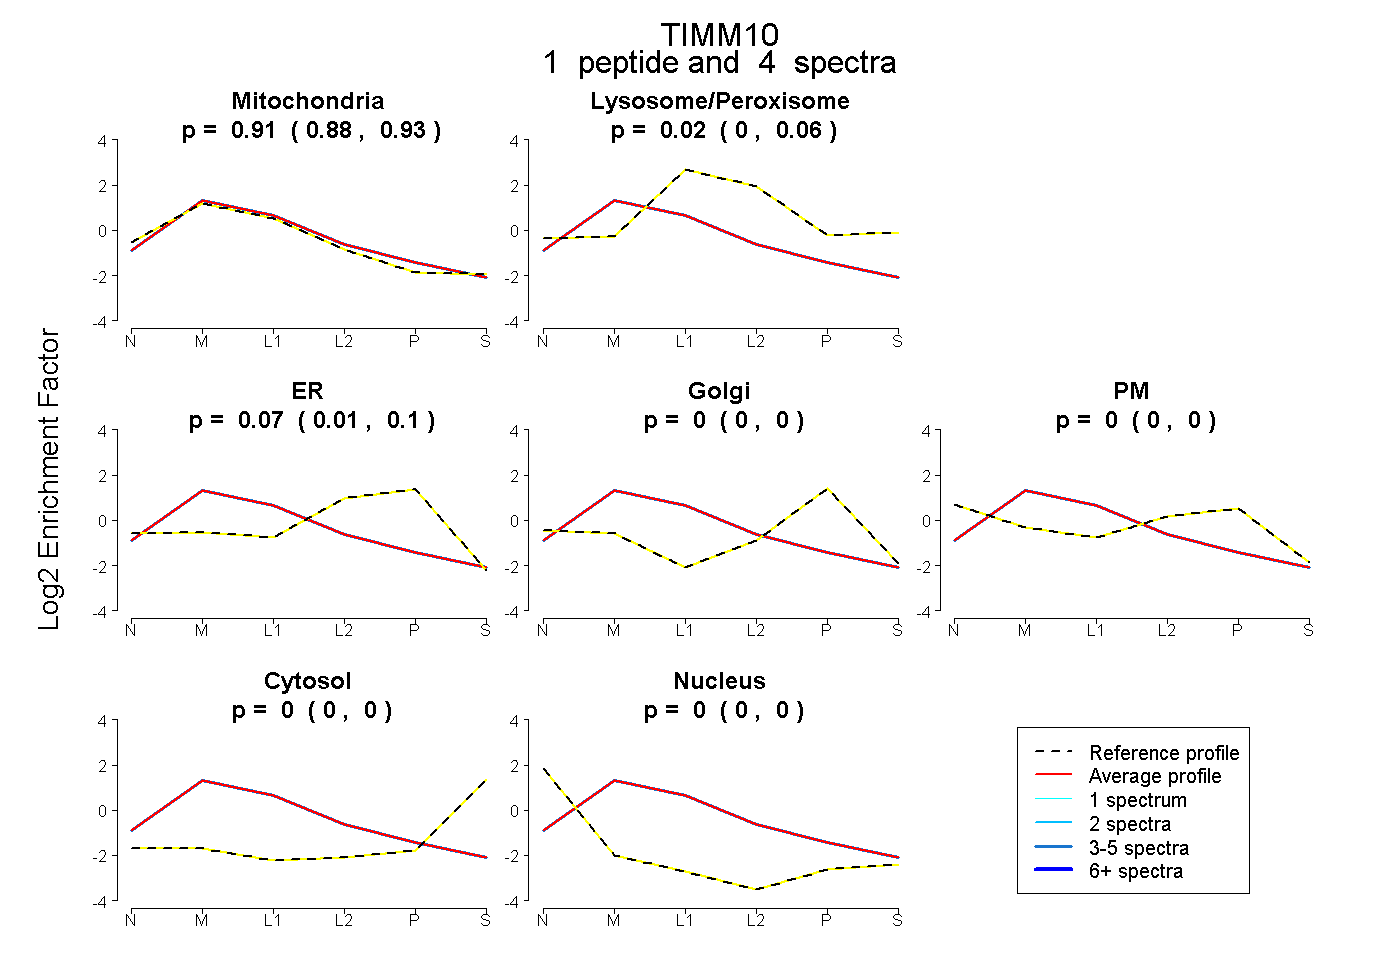 |
0.913 0.879 | 0.931 |
0.015 0.000 | 0.060 |
0.072 0.012 | 0.097 |
0.000 0.000 | 0.000 |
0.000 0.000 | 0.000 |
0.000 0.000 | 0.000 |
0.000 0.000 | 0.000 |
|||
| Plot | Lyso | Other | |||||||||||
| Expt C |
4 peptides |
35 spectra |
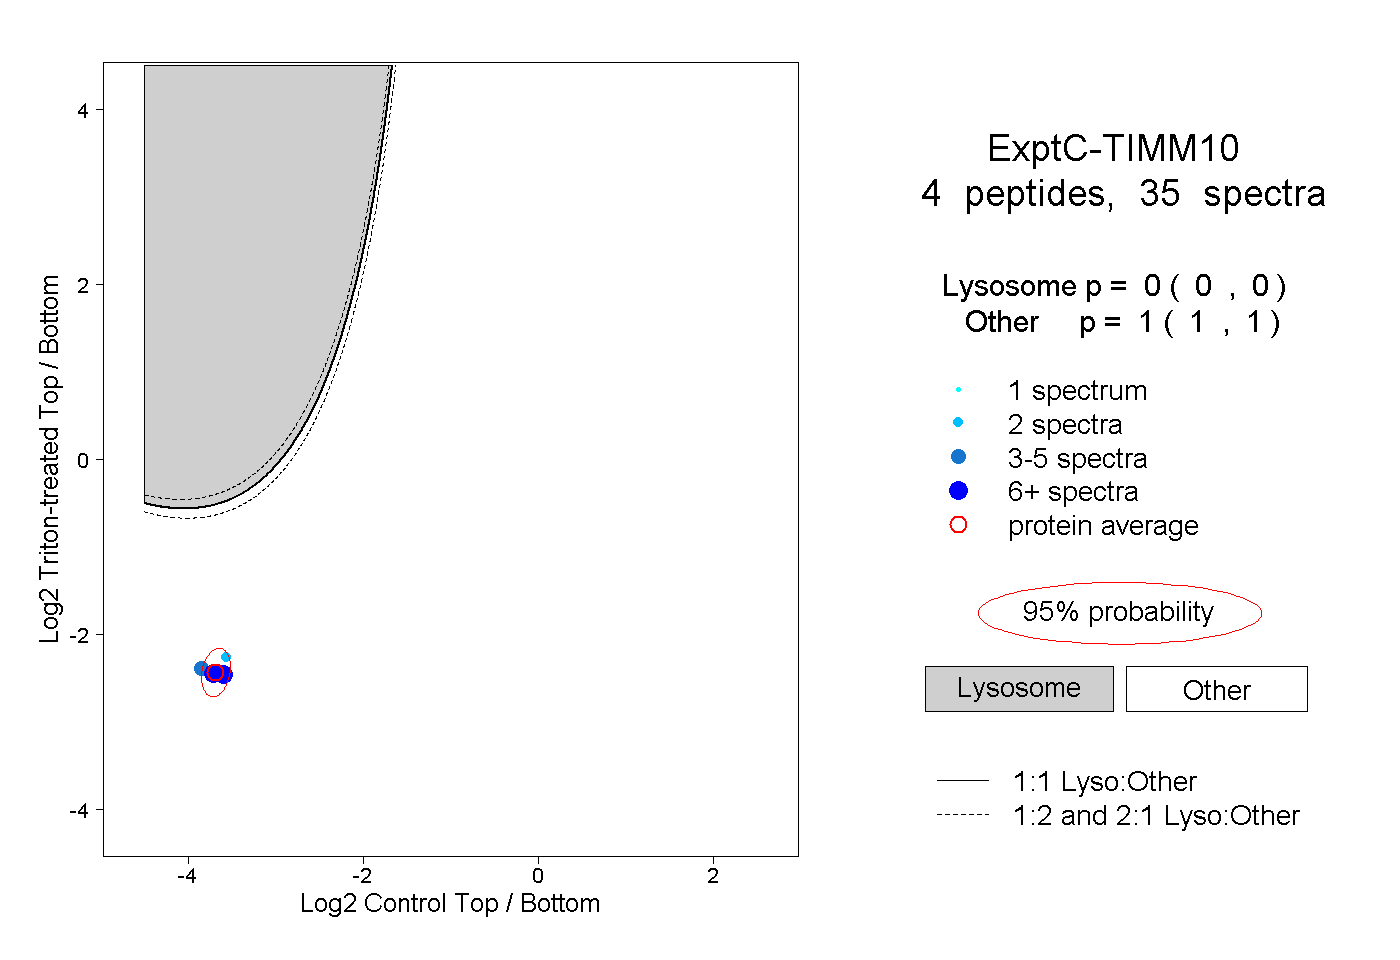 |
0.000 0.000 | 0.000 |
1.000 1.000 | 1.000 |
||||||||
| Plot | Lyso | Other | |||||||||||
| Expt D |
2 peptides |
4 spectra |
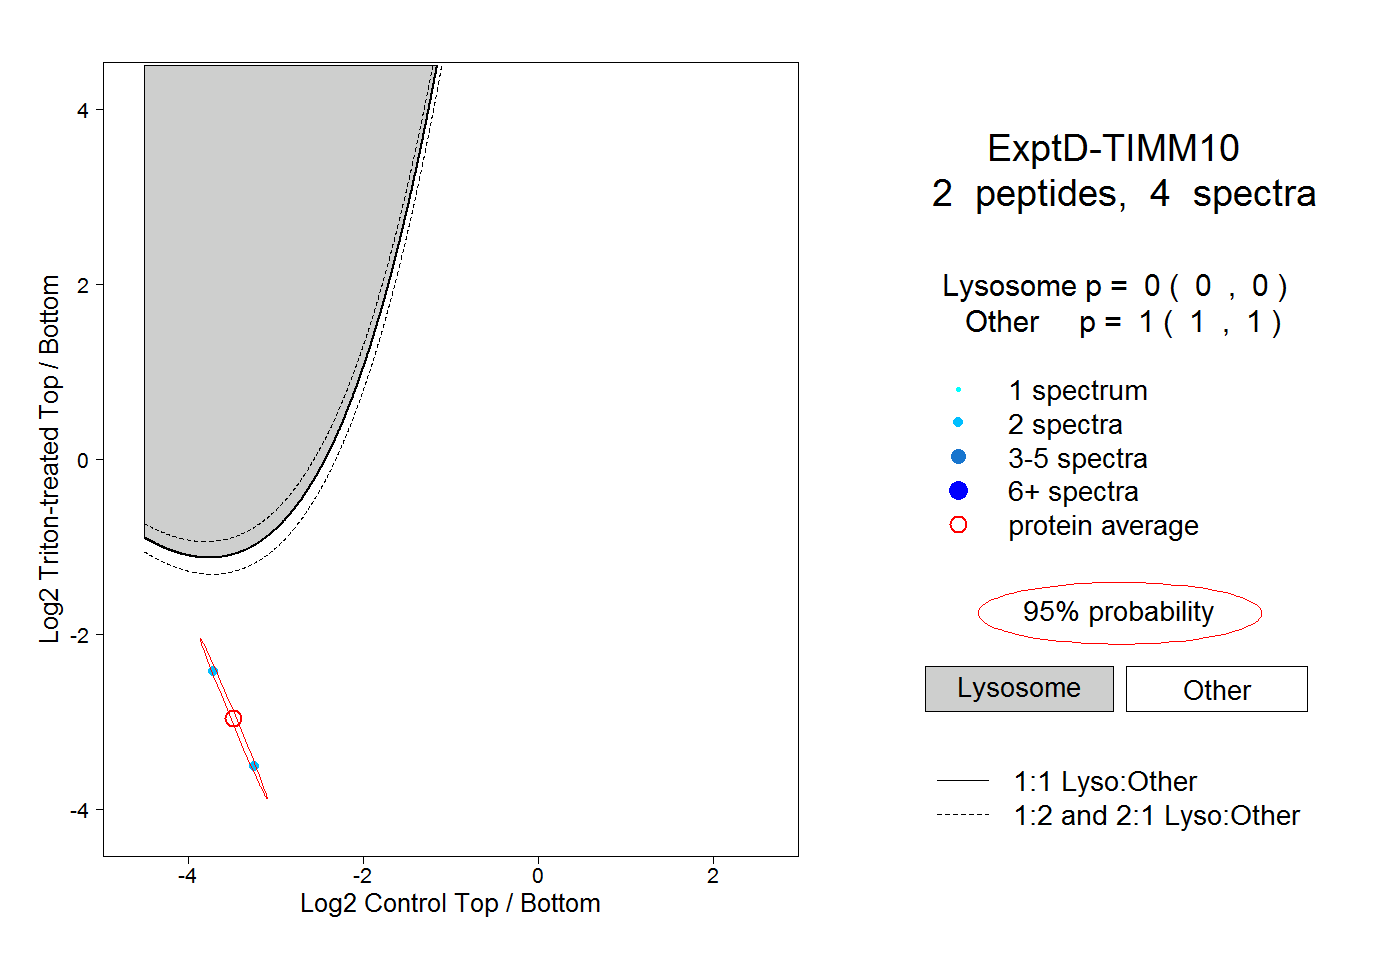 |
0.000 0.000 | 0.000 |
1.000 1.000 | 1.000 |