 12
12peptides
spectra
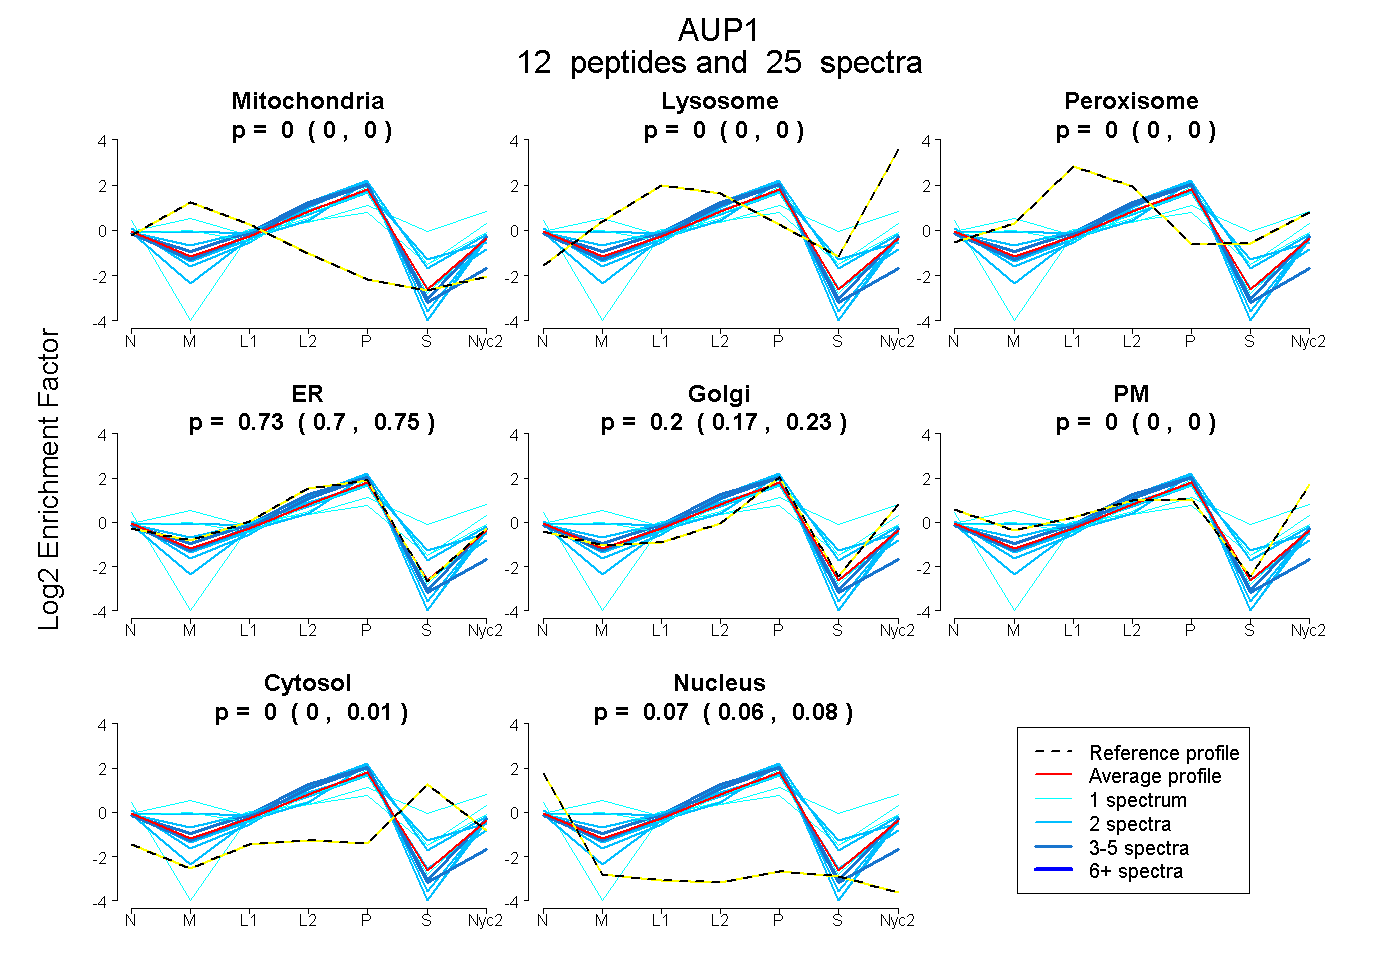
0.000 | 0.000
0.000 | 0.000
0.000 | 0.000
0.705 | 0.750
0.169 | 0.225
0.000 | 0.000
0.000 | 0.005
0.061 | 0.076
6peptides
spectra
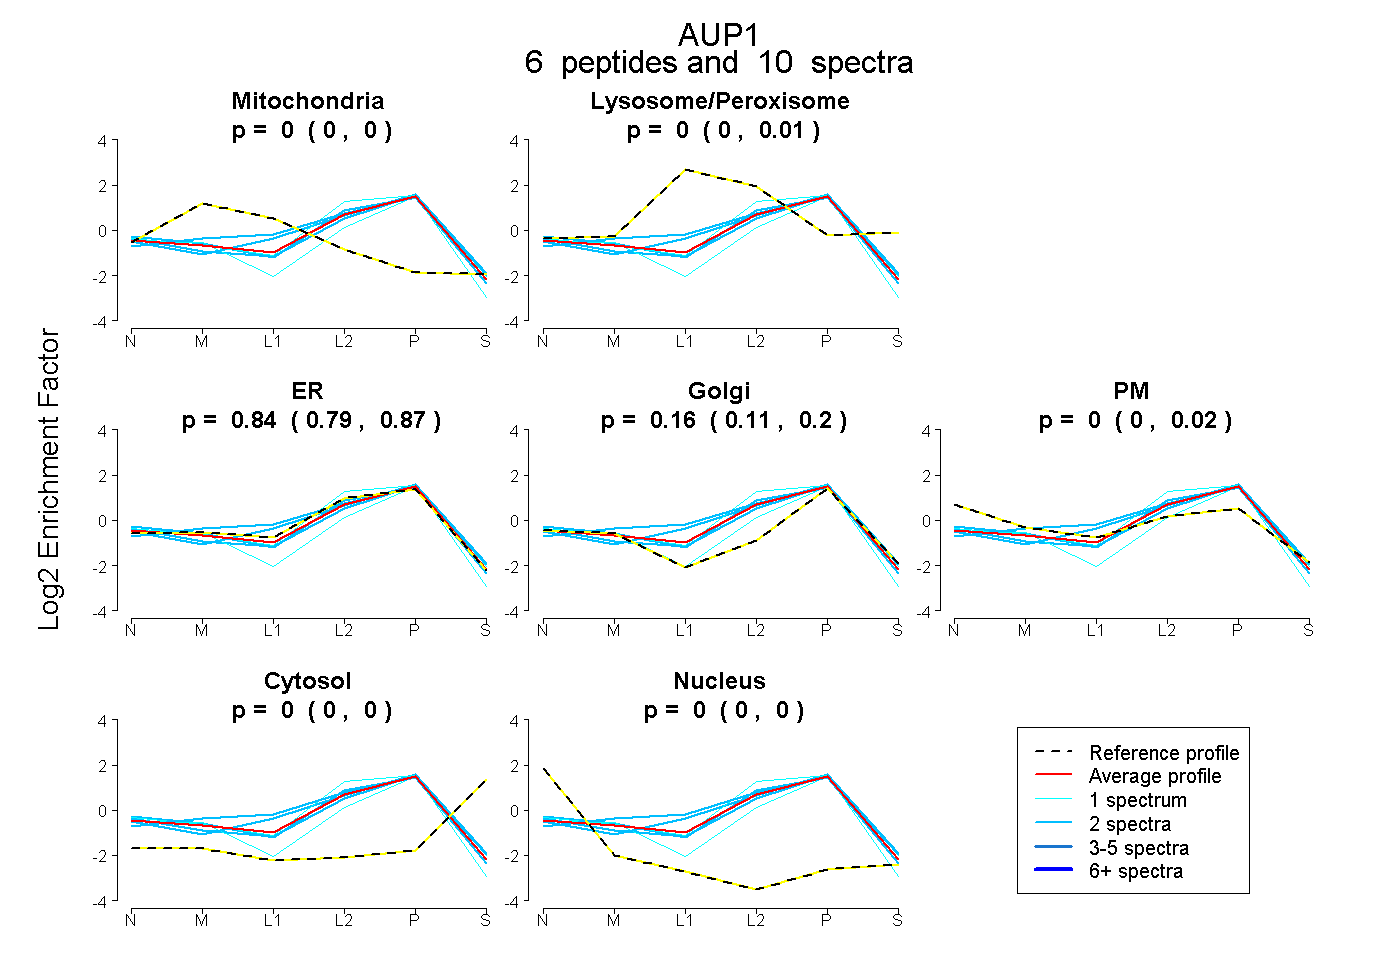
0.000 | 0.000
0.000 | 0.006
0.789 | 0.872
0.111 | 0.201
0.000 | 0.018
0.000 | 0.000
0.000 | 0.000
11peptides
spectra
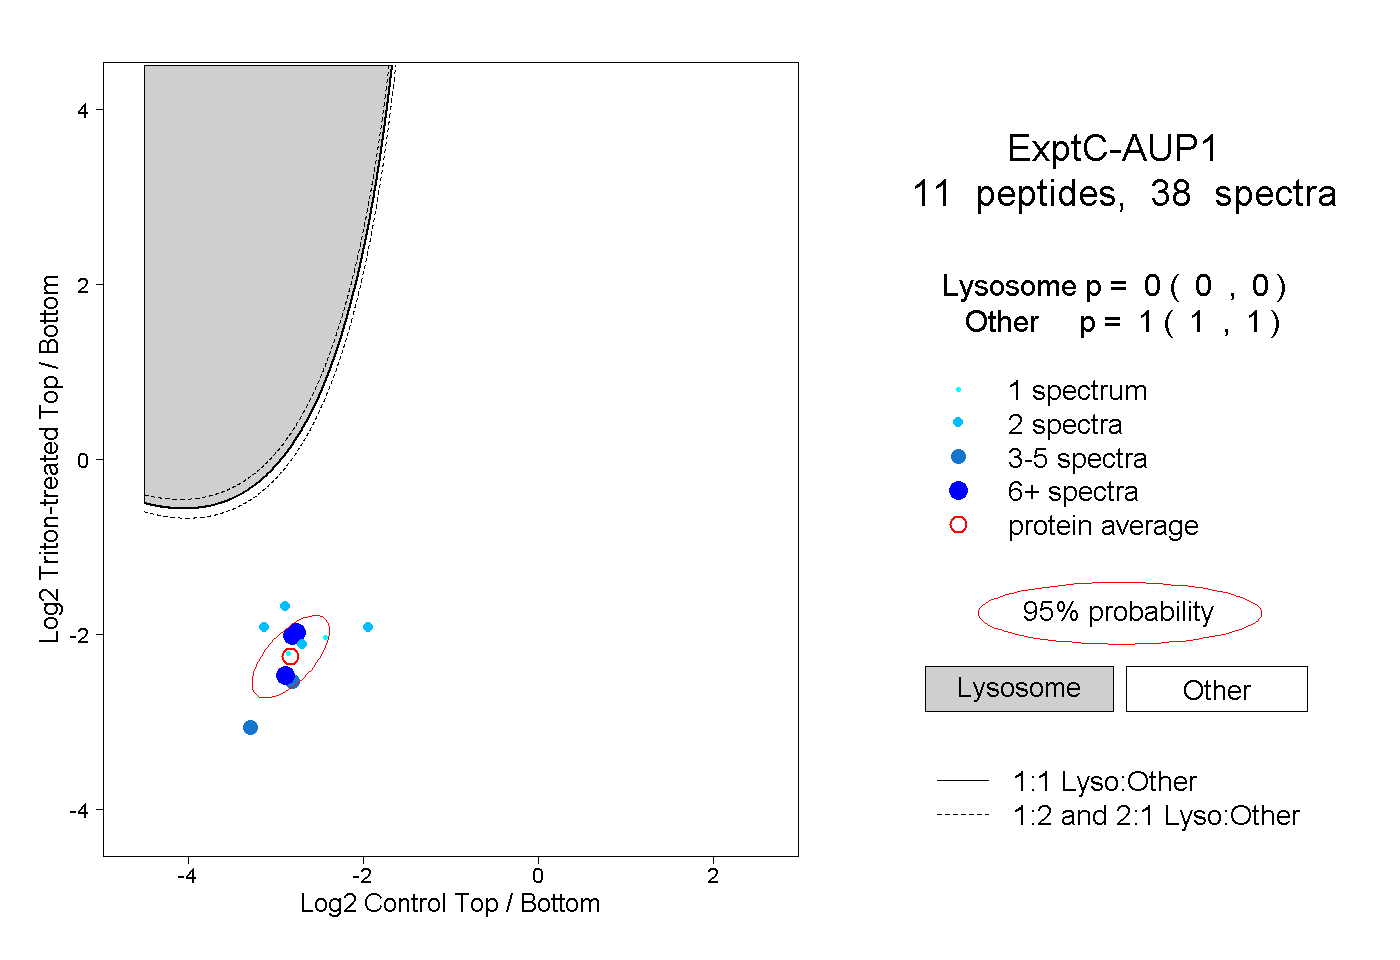
0.000 | 0.000
1.000 | 1.000
2peptides
spectra
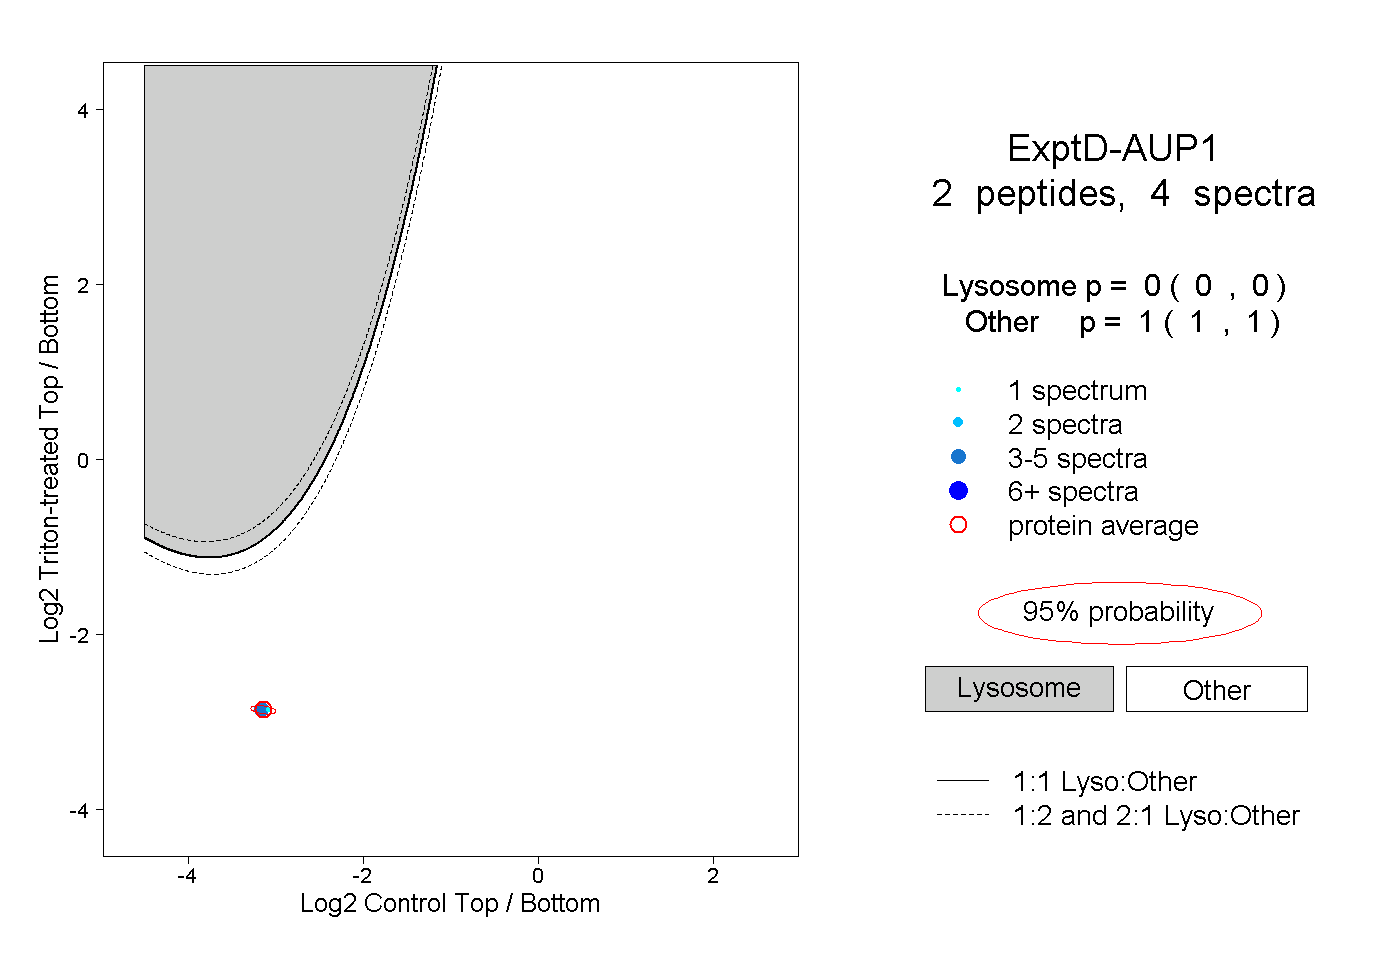
0.000 | 0.000
1.000 | 1.000