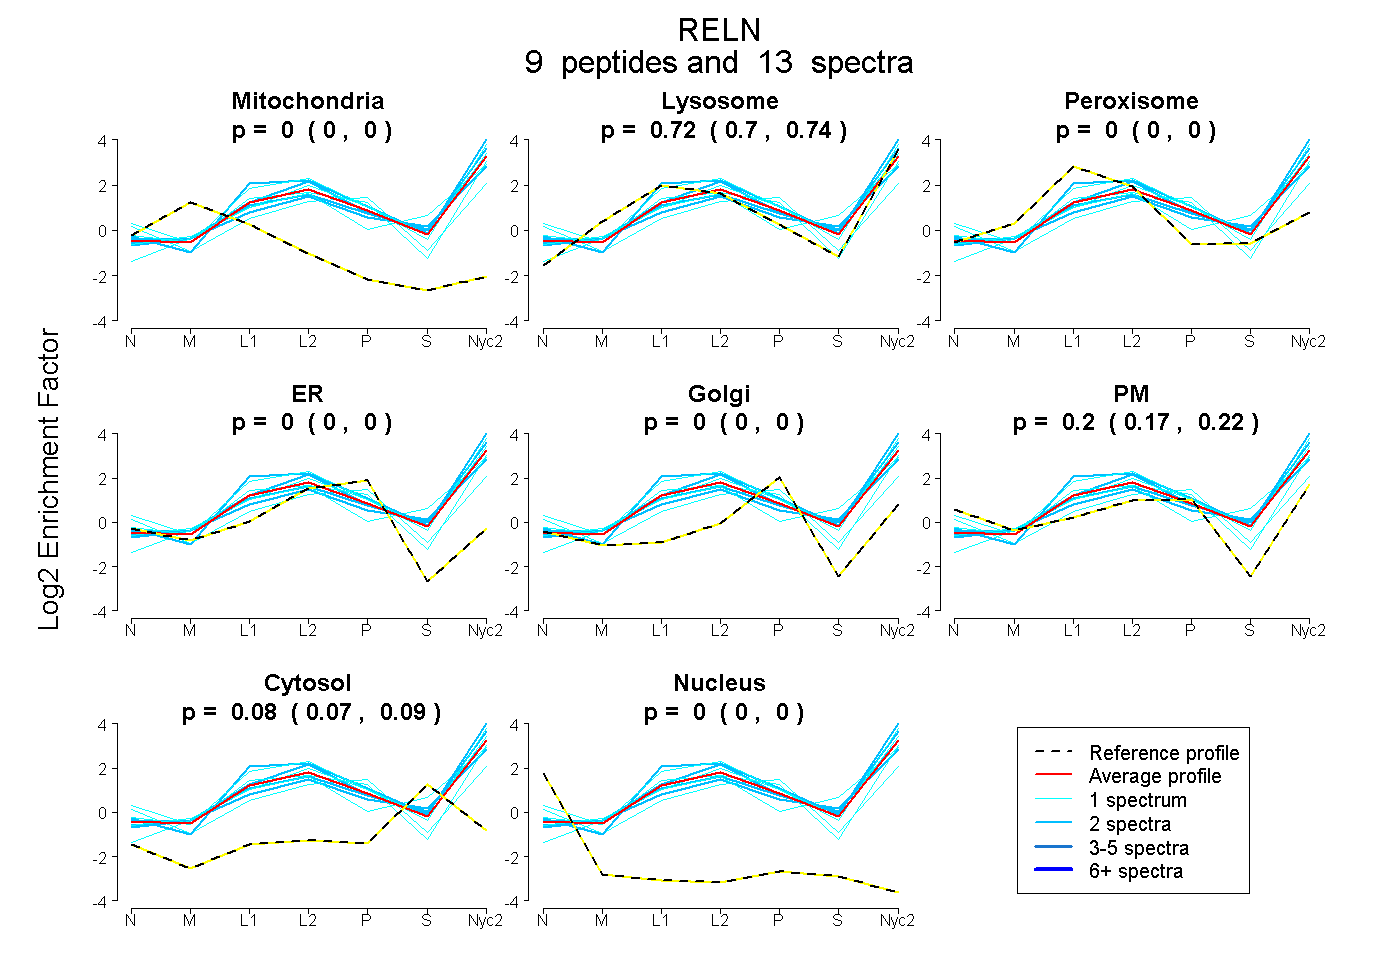
 9
9peptides
spectra
0.000 | 0.000
0.696 | 0.736
0.000 | 0.000
0.000 | 0.000
0.000 | 0.000
0.175 | 0.221
0.069 | 0.092
0.000 | 0.000
| Plot | Mito | Lyso | Perox | ER | Golgi | PM | Cytosol | Nucleus | |||||
| Expt A |
9 peptides |
13 spectra |
|
0.000 0.000 | 0.000 |
0.718 0.696 | 0.736 |
0.000 0.000 | 0.000 |
0.000 0.000 | 0.000 |
0.000 0.000 | 0.000 |
0.201 0.175 | 0.221 |
0.081 0.069 | 0.092 |
0.000 0.000 | 0.000 |
| 1 spectrum, SVLSTCR | 0.000 | 0.487 | 0.000 | 0.000 | 0.000 | 0.513 | 0.000 | 0.000 | ||
| 1 spectrum, ALVFNK | 0.000 | 0.273 | 0.000 | 0.054 | 0.059 | 0.519 | 0.094 | 0.000 | ||
| 2 spectra, ITLPLPAYTR | 0.000 | 0.886 | 0.000 | 0.000 | 0.000 | 0.114 | 0.000 | 0.000 | ||
| 2 spectra, FLLMSGGKPSR | 0.000 | 0.850 | 0.000 | 0.000 | 0.000 | 0.086 | 0.064 | 0.000 | ||
| 1 spectrum, QFGIQFR | 0.000 | 0.748 | 0.000 | 0.000 | 0.000 | 0.193 | 0.058 | 0.000 | ||
| 1 spectrum, VTIPLPNAALTR | 0.000 | 0.826 | 0.000 | 0.000 | 0.000 | 0.174 | 0.000 | 0.000 | ||
| 1 spectrum, ISGGQVGTGCGTLSDGR | 0.000 | 0.770 | 0.000 | 0.000 | 0.000 | 0.000 | 0.230 | 0.000 | ||
| 2 spectra, FQNWR | 0.000 | 0.647 | 0.000 | 0.000 | 0.000 | 0.174 | 0.179 | 0.000 | ||
| 2 spectra, IISVELPDDAK | 0.000 | 0.751 | 0.000 | 0.000 | 0.000 | 0.125 | 0.124 | 0.000 |
| Plot | Lyso | Other | |||||||||||
| Expt C |
17 peptides |
44 spectra |
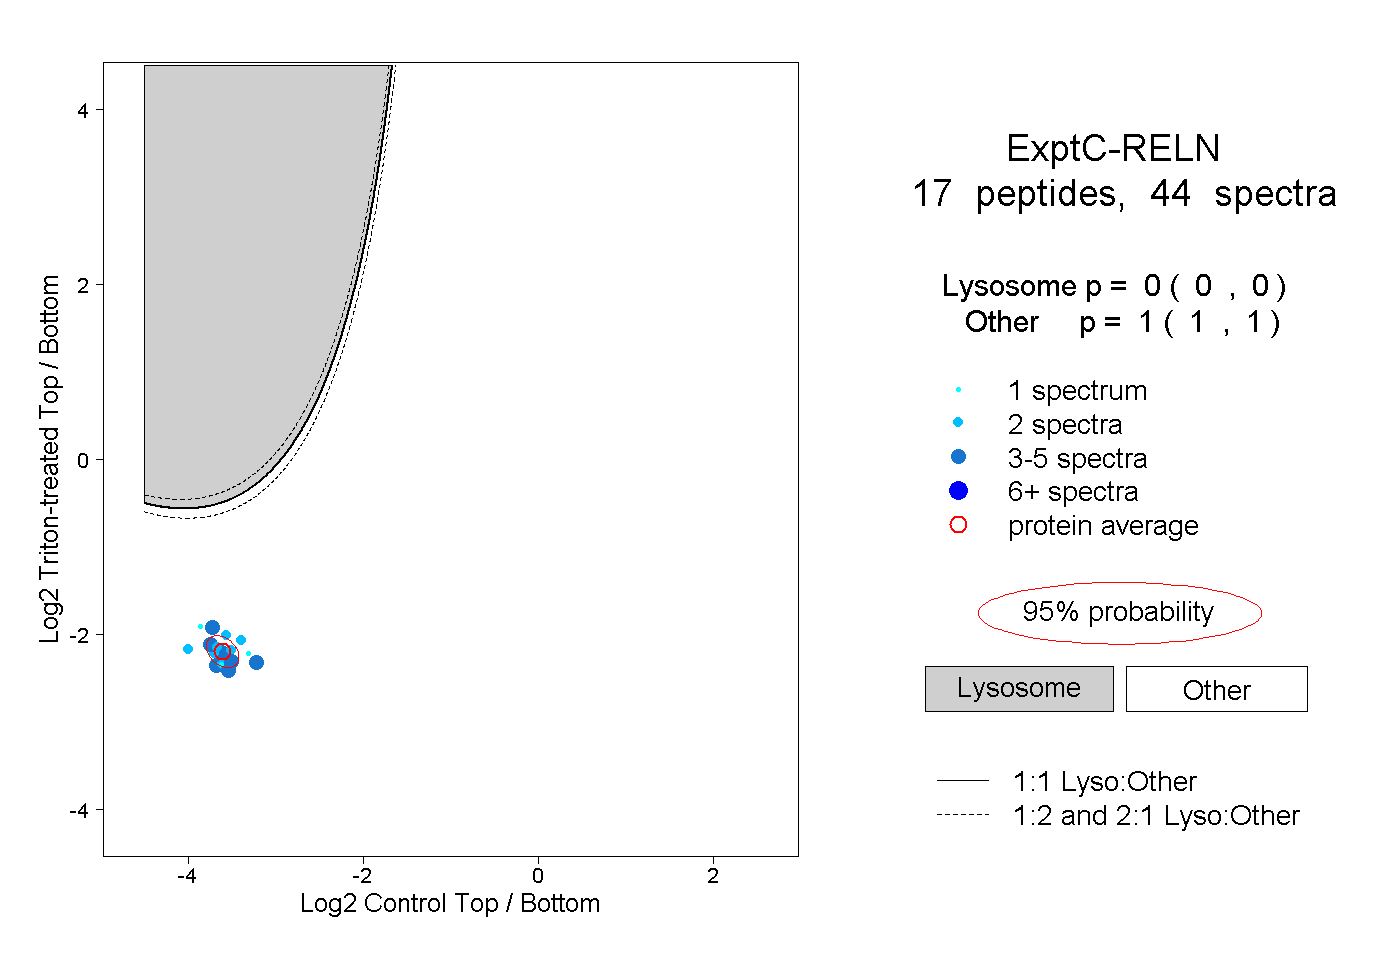 |
0.000 0.000 | 0.000 |
1.000 1.000 | 1.000 |
||||||||
| Plot | Lyso | Other | |||||||||||
| Expt D |
3 peptides |
4 spectra |
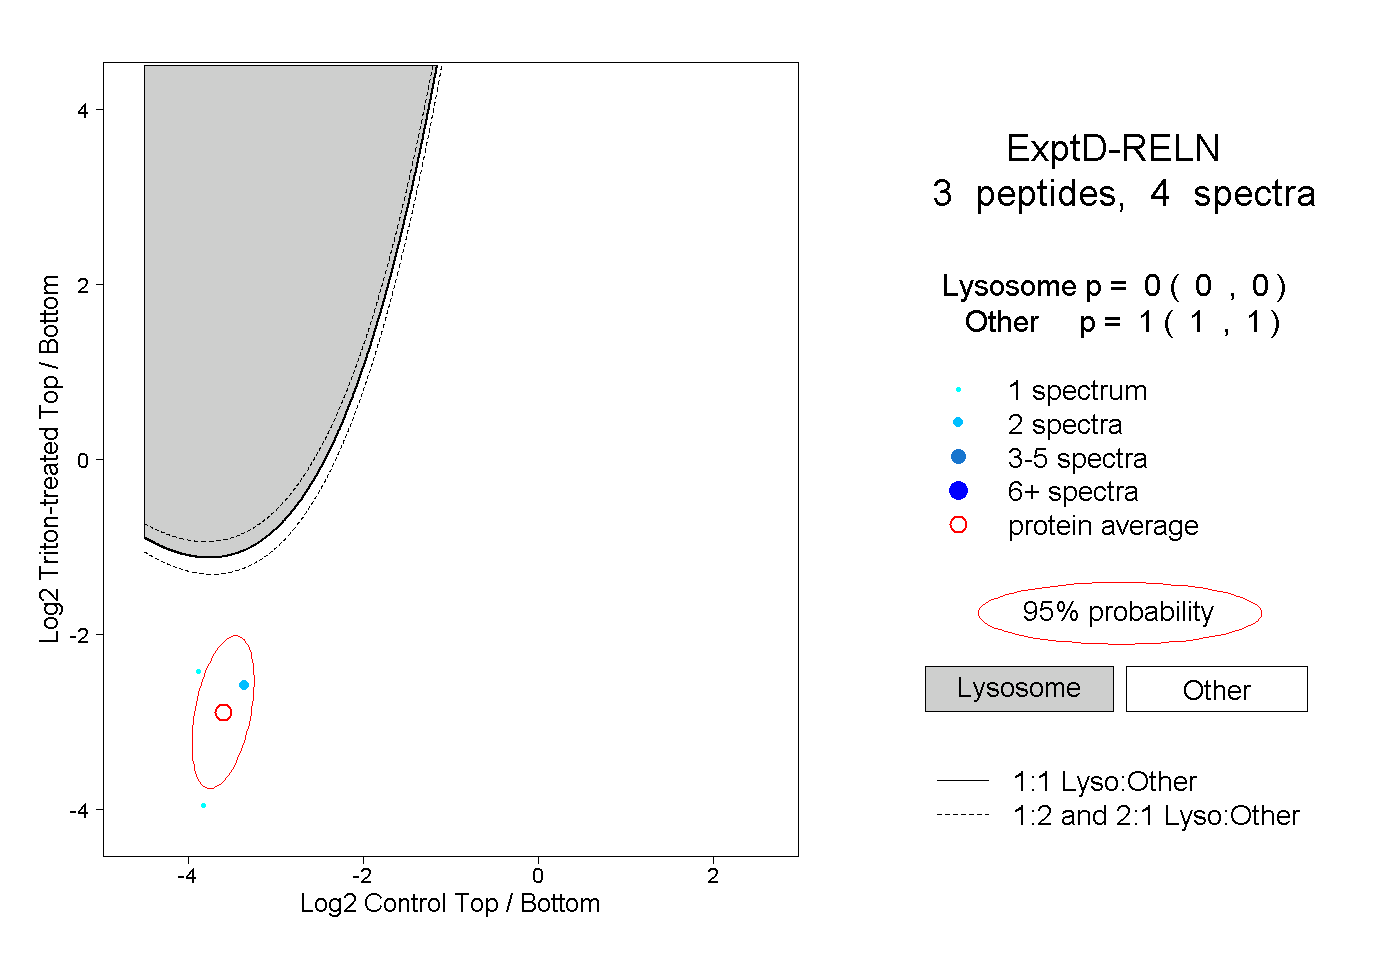 |
0.000 0.000 | 0.000 |
1.000 1.000 | 1.000 |