 9
9peptides
spectra

0.000 | 0.000
0.000 | 0.005
0.000 | 0.026
0.000 | 0.000
0.036 | 0.082
0.115 | 0.178
0.768 | 0.780
0.000 | 0.000
| Plot | Mito | Lyso | Perox | ER | Golgi | PM | Cytosol | Nucleus | |||||
| Expt A |
9 peptides |
55 spectra |
|
0.000 0.000 | 0.000 |
0.000 0.000 | 0.005 |
0.013 0.000 | 0.026 |
0.000 0.000 | 0.000 |
0.061 0.036 | 0.082 |
0.151 0.115 | 0.178 |
0.774 0.768 | 0.780 |
0.000 0.000 | 0.000 |
| 3 spectra, DAVLLVFANK | 0.000 | 0.006 | 0.000 | 0.000 | 0.088 | 0.131 | 0.775 | 0.000 | ||
| 3 spectra, VQESADELQK | 0.000 | 0.000 | 0.000 | 0.000 | 0.222 | 0.000 | 0.778 | 0.000 | ||
| 1 spectrum, HYFQNTQGLIFVVDSNDR | 0.000 | 0.256 | 0.000 | 0.000 | 0.000 | 0.000 | 0.744 | 0.000 | ||
| 3 spectra, MLQEDELR | 0.000 | 0.000 | 0.000 | 0.000 | 0.028 | 0.166 | 0.807 | 0.000 | ||
| 21 spectra, LRPLWR | 0.000 | 0.000 | 0.062 | 0.000 | 0.028 | 0.256 | 0.654 | 0.000 | ||
| 2 spectra, NICFTVWDVGGQDK | 0.060 | 0.000 | 0.000 | 0.000 | 0.000 | 0.000 | 0.827 | 0.112 | ||
| 4 spectra, TTILYK | 0.000 | 0.092 | 0.016 | 0.000 | 0.000 | 0.196 | 0.695 | 0.000 | ||
| 2 spectra, QDMPNAMPVSELTDK | 0.000 | 0.071 | 0.000 | 0.000 | 0.000 | 0.212 | 0.717 | 0.000 | ||
| 16 spectra, LGLQHLR | 0.000 | 0.000 | 0.067 | 0.016 | 0.122 | 0.000 | 0.786 | 0.008 |
| Plot | Mito | Lyso or Perox | ER | Golgi | PM | Cytosol | Nucleus | ||||||
| Expt B |
3 peptides |
3 spectra |
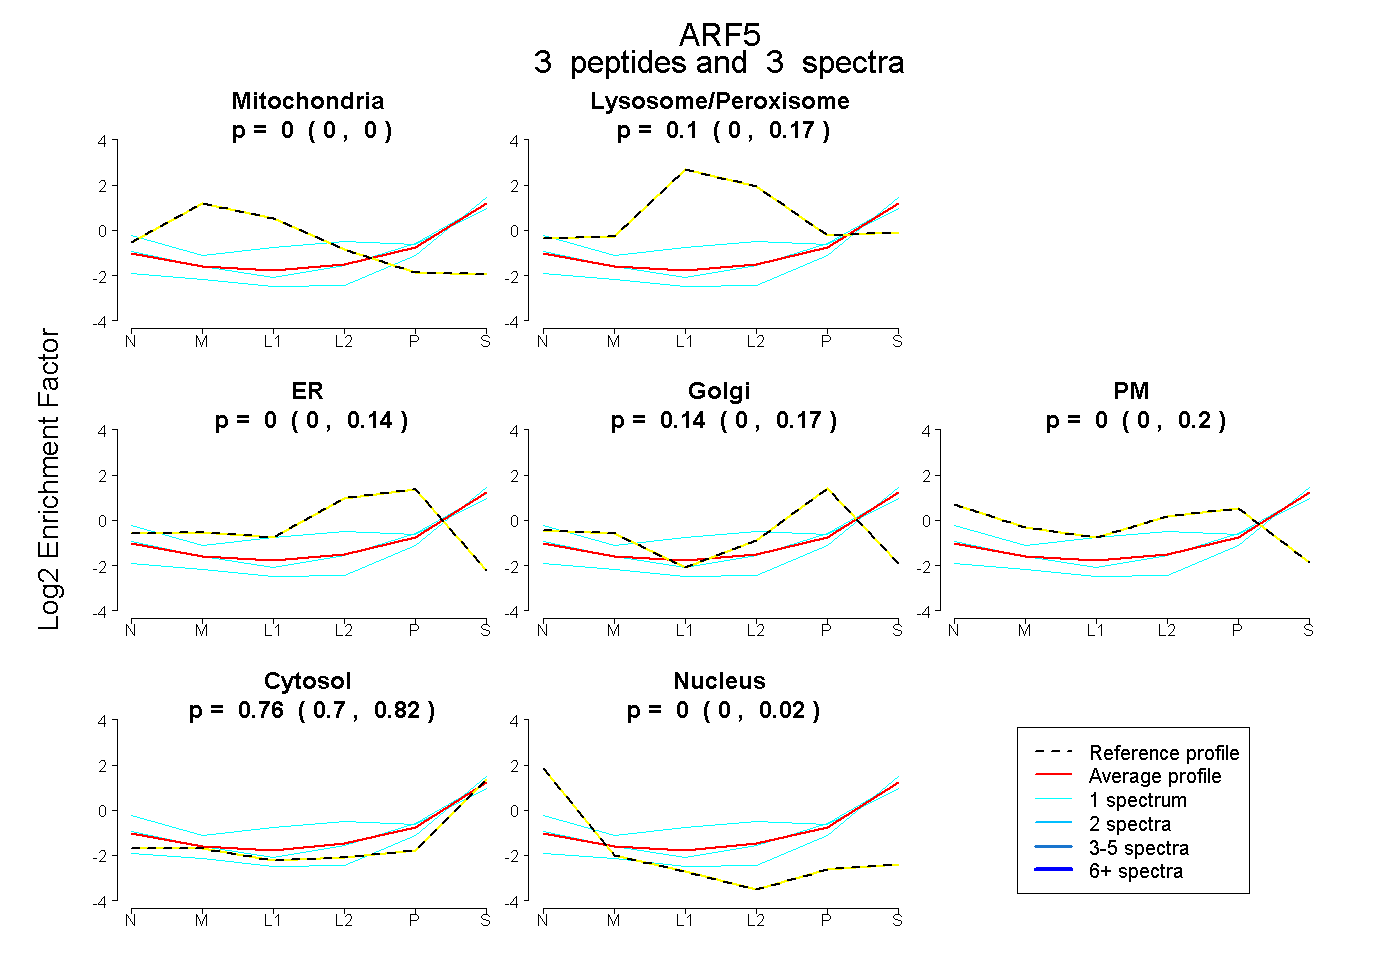 |
0.000 0.000 | 0.000 |
0.096 0.000 | 0.166 |
0.000 0.000 | 0.140 |
0.141 0.000 | 0.175 |
0.003 0.000 | 0.198 |
0.760 0.696 | 0.822 |
0.000 0.000 | 0.021 |
|||
| Plot | Lyso | Other | |||||||||||
| Expt C |
5 peptides |
20 spectra |
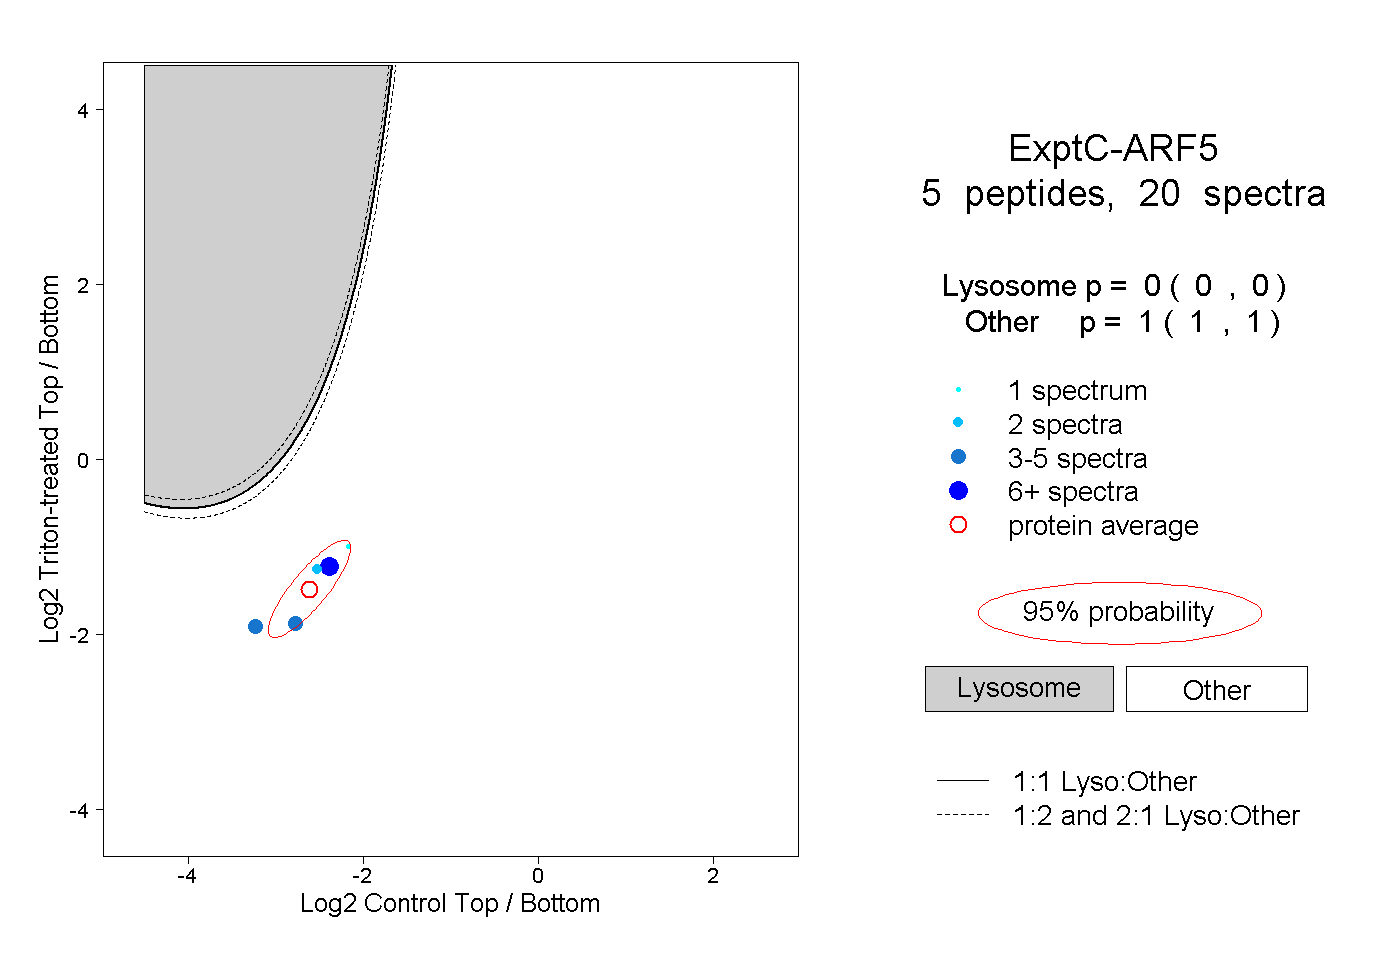 |
0.000 0.000 | 0.000 |
1.000 1.000 | 1.000 |
||||||||
| Plot | Lyso | Other | |||||||||||
| Expt D |
2 peptides |
7 spectra |
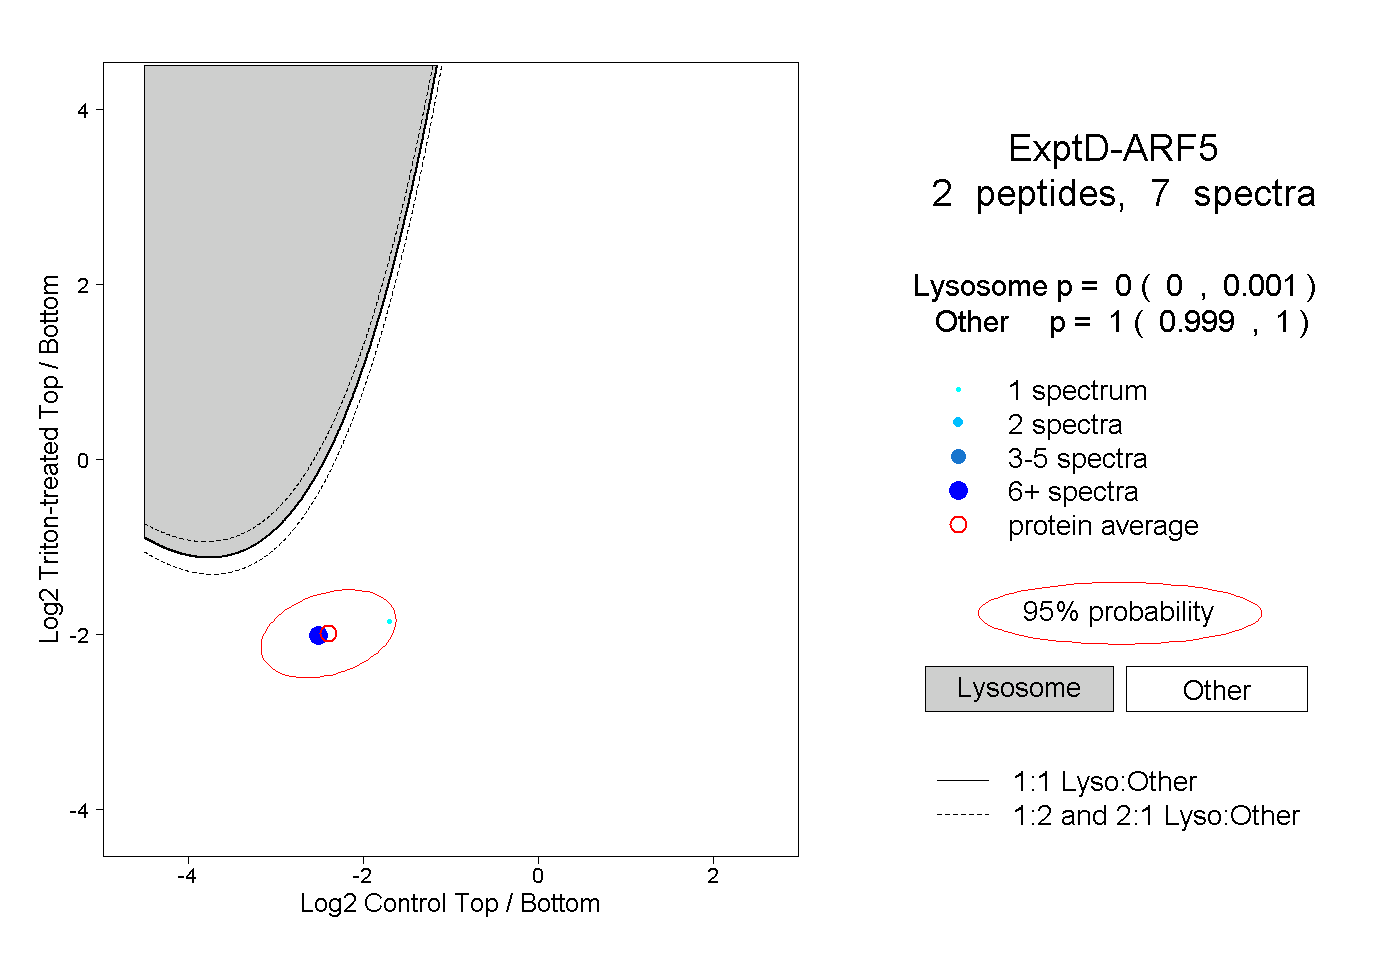 |
0.000 0.000 | 0.001 |
1.000 0.999 | 1.000 |