 23
23peptides
spectra
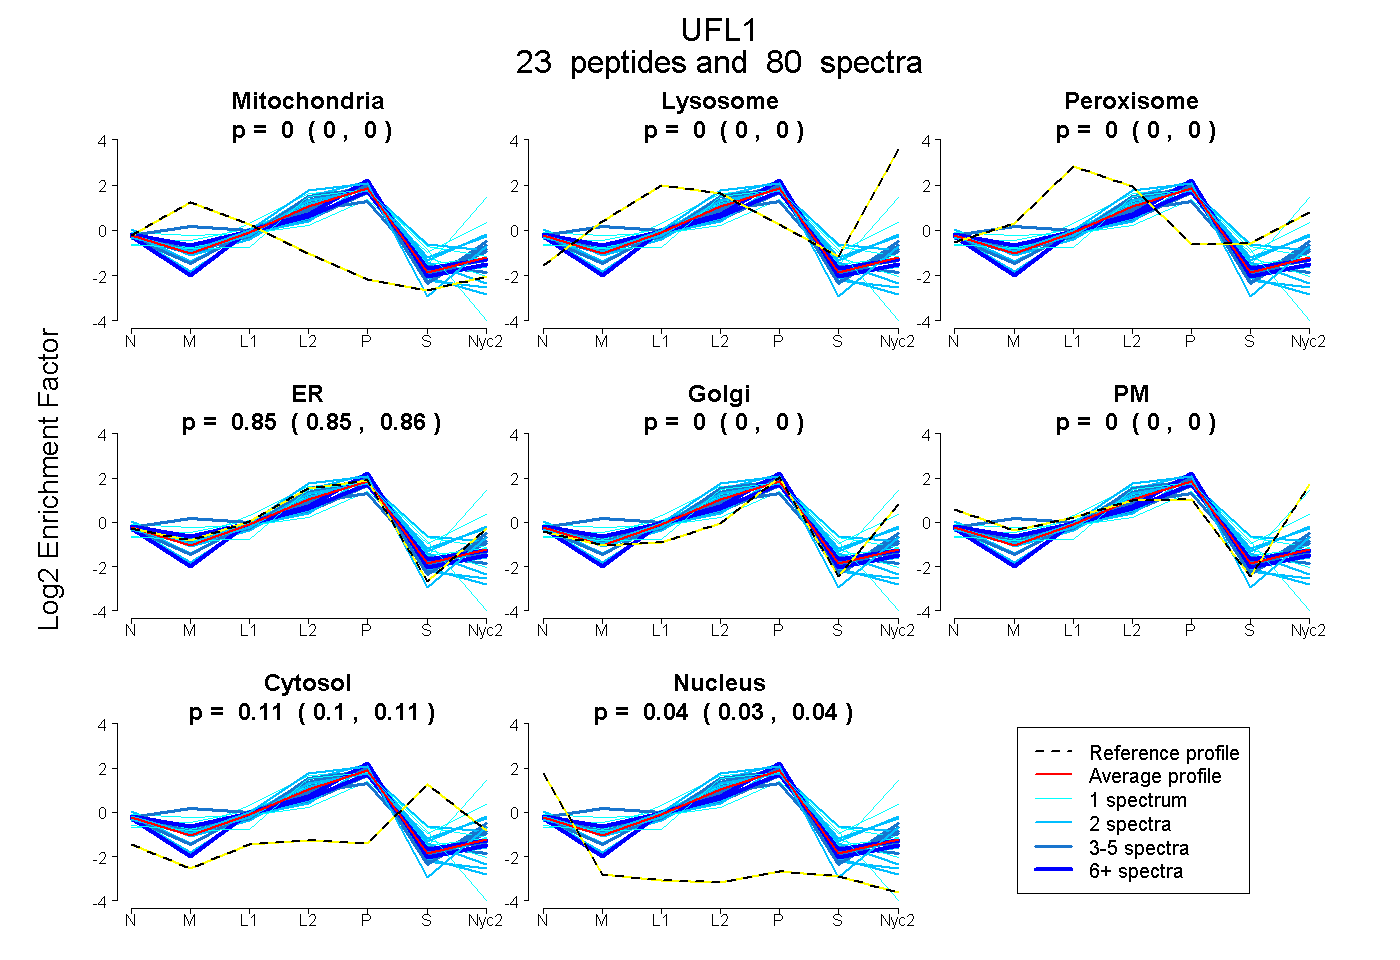
0.000 | 0.000
0.000 | 0.000
0.000 | 0.000
0.851 | 0.856
0.000 | 0.000
0.000 | 0.000
0.104 | 0.112
0.035 | 0.041
20peptides
spectra
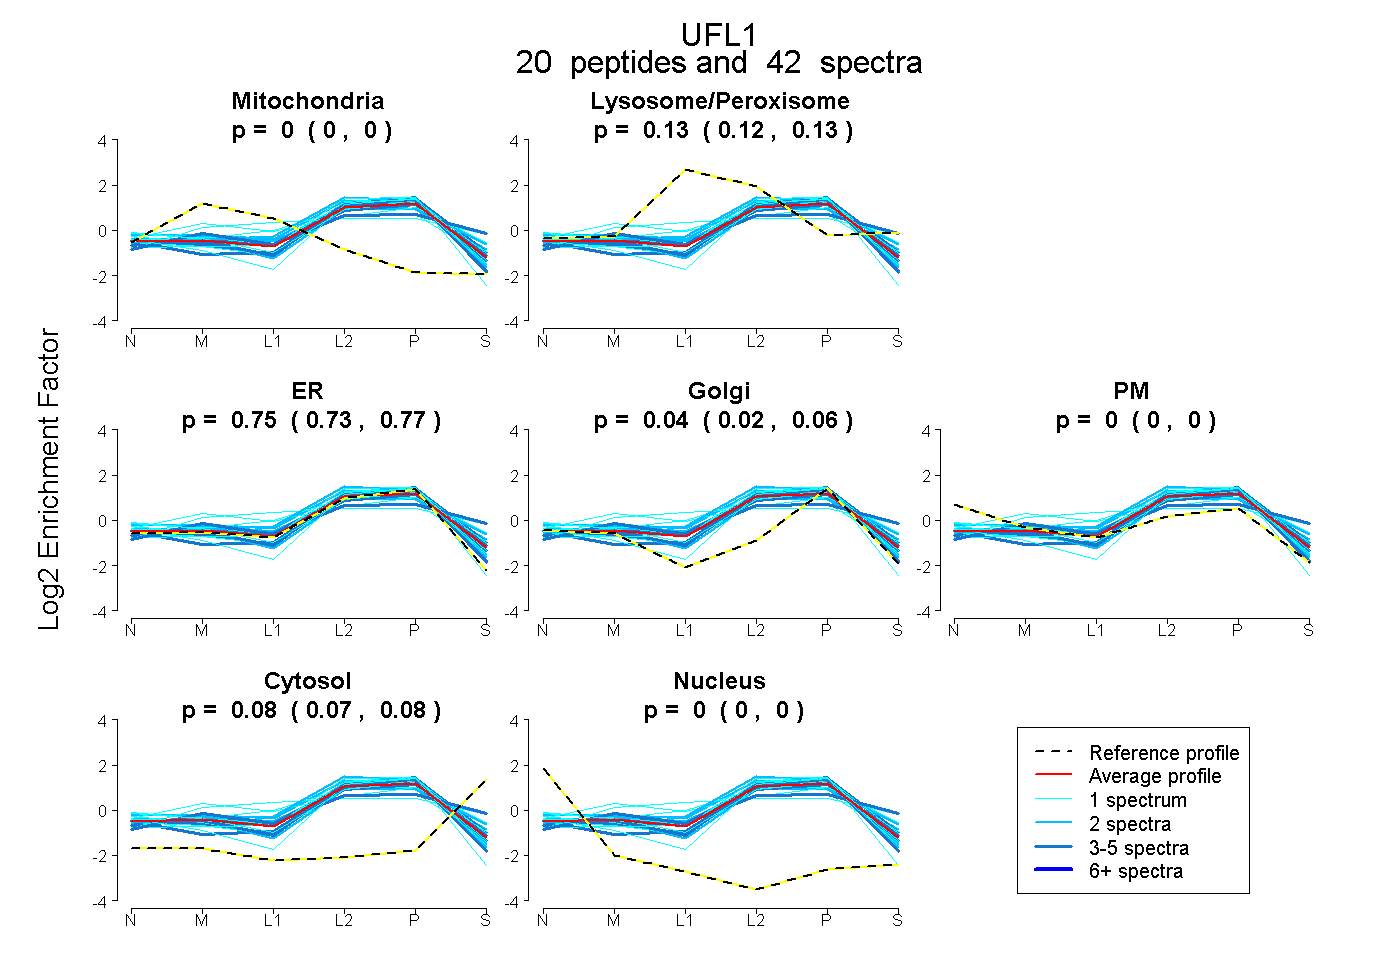
0.000 | 0.000
0.116 | 0.134
0.734 | 0.772
0.024 | 0.055
0.000 | 0.000
0.072 | 0.084
0.000 | 0.000
31peptides
spectra
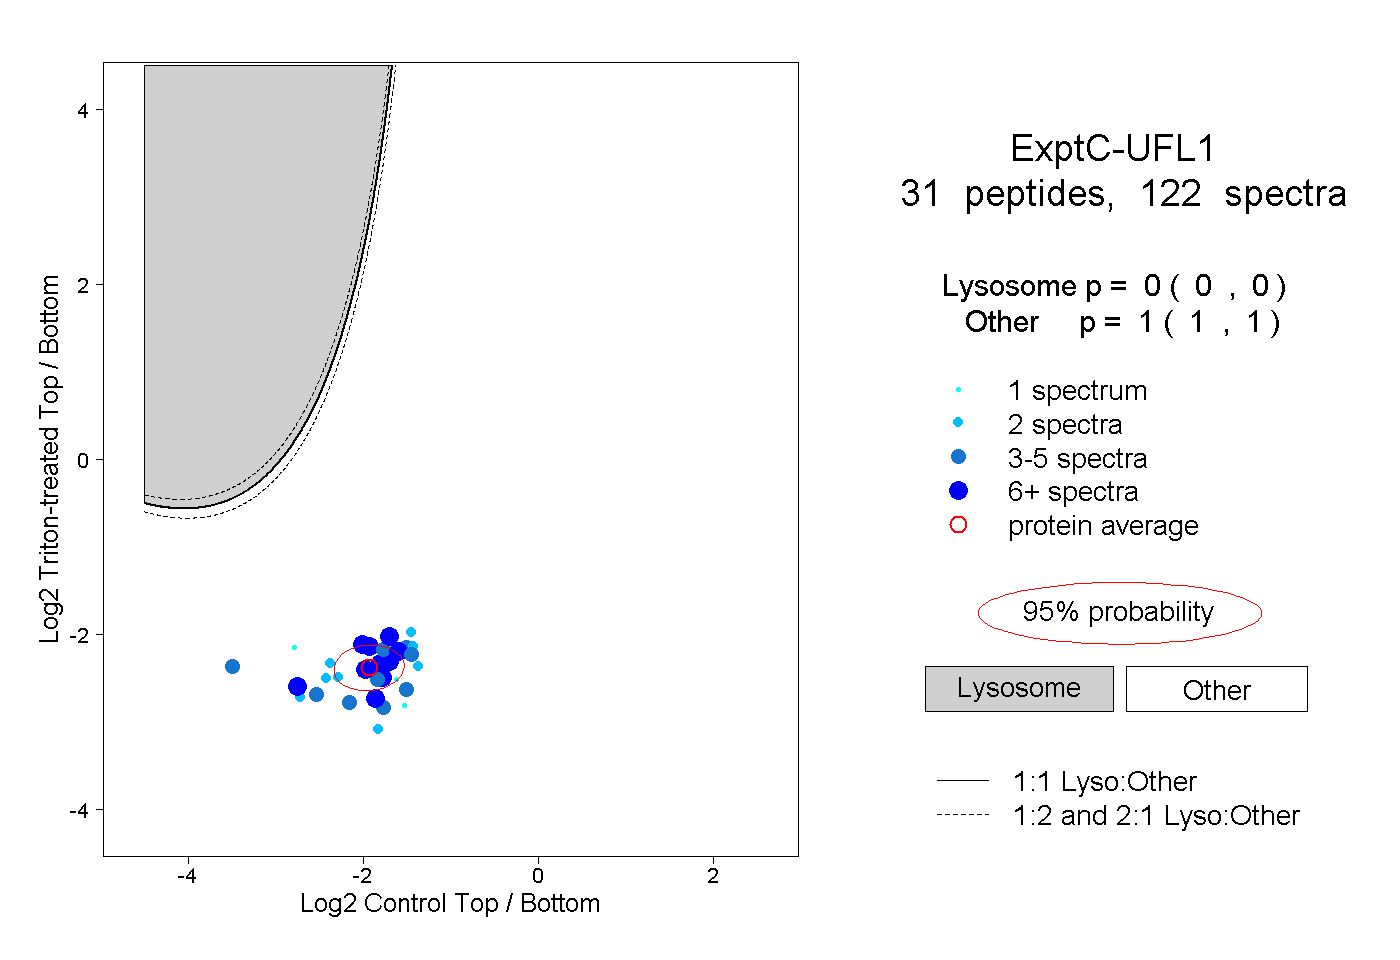
0.000 | 0.000
1.000 | 1.000
11peptides
spectra
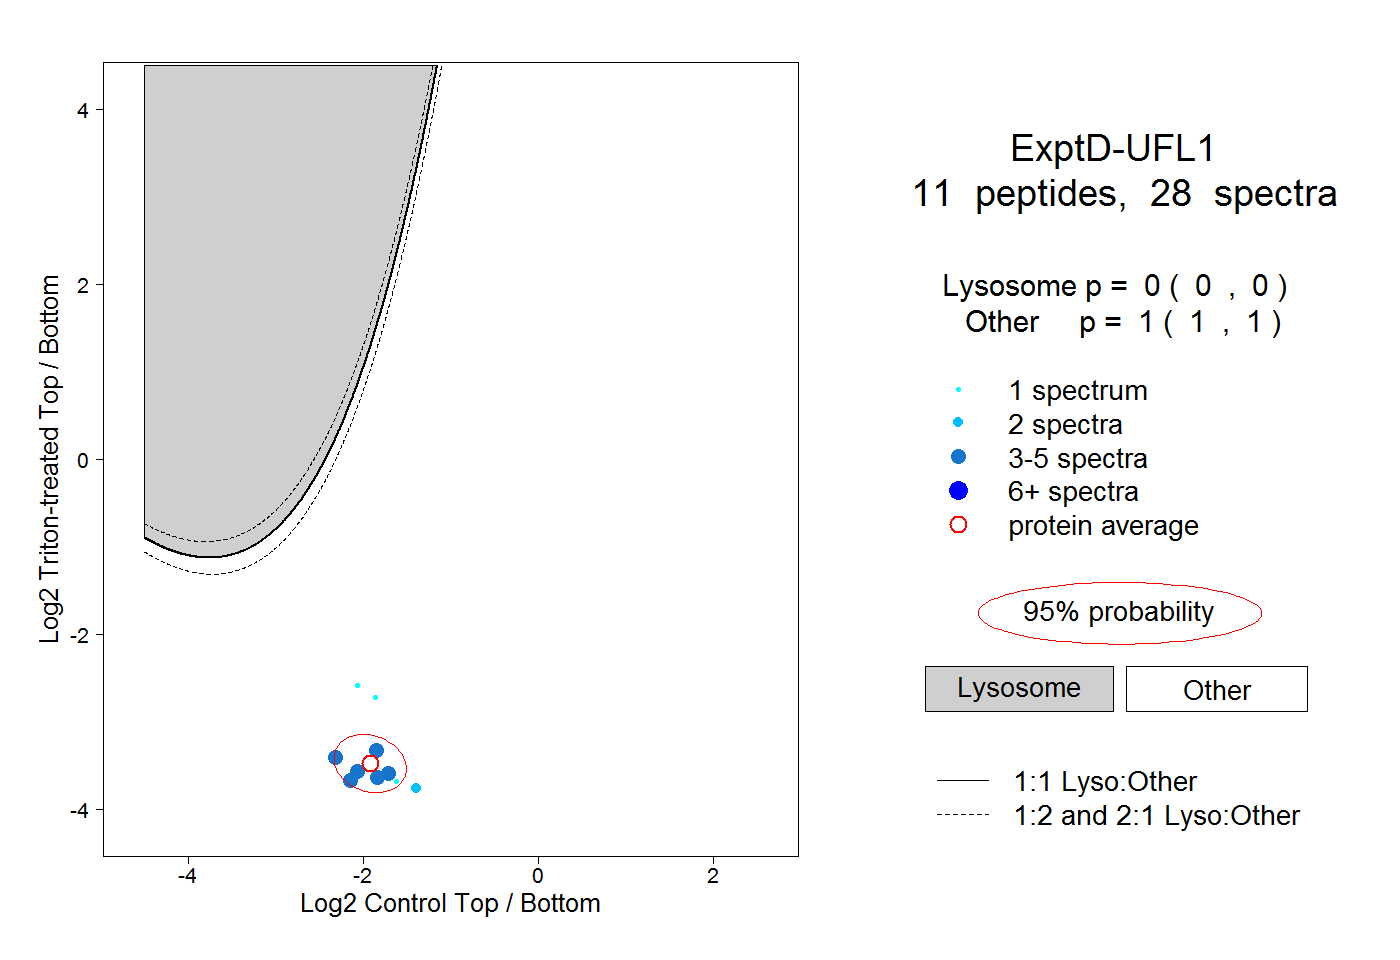
0.000 | 0.000
1.000 | 1.000