ELOVL5
[ENSRNOP00000010409]
Main page
| | | Plot |
Mito |
Lyso |
|
Perox |
ER |
Golgi |
PM |
Cytosol |
Nucleus |
|
| Expt A |
 5
5
peptides |
32
spectra |
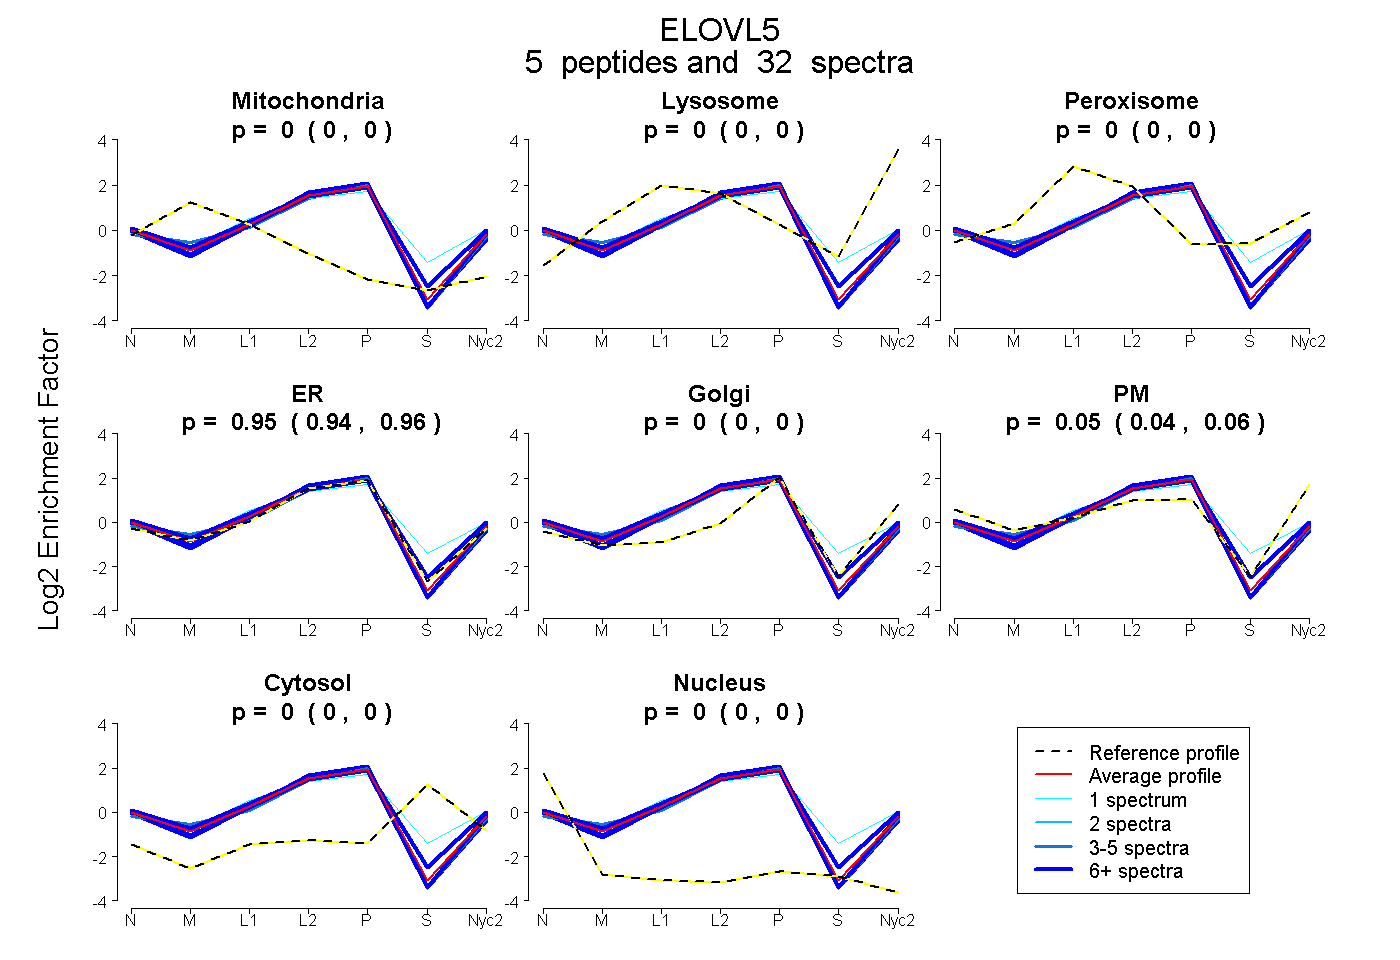 |
0.000
0.000 | 0.000 |
0.000
0.000 | 0.000 |
|
0.000
0.000 | 0.000 |
0.950
0.938 | 0.960 |
0.000
0.000 | 0.000 |
0.050
0.038 | 0.059 |
0.000
0.000 | 0.000 |
0.000
0.000 | 0.000 |
|
| | | Plot |
Mito |
|
Lyso or Perox |
|
ER |
Golgi |
PM |
Cytosol |
Nucleus |
|
| Expt B |
1
peptide |
10
spectra |
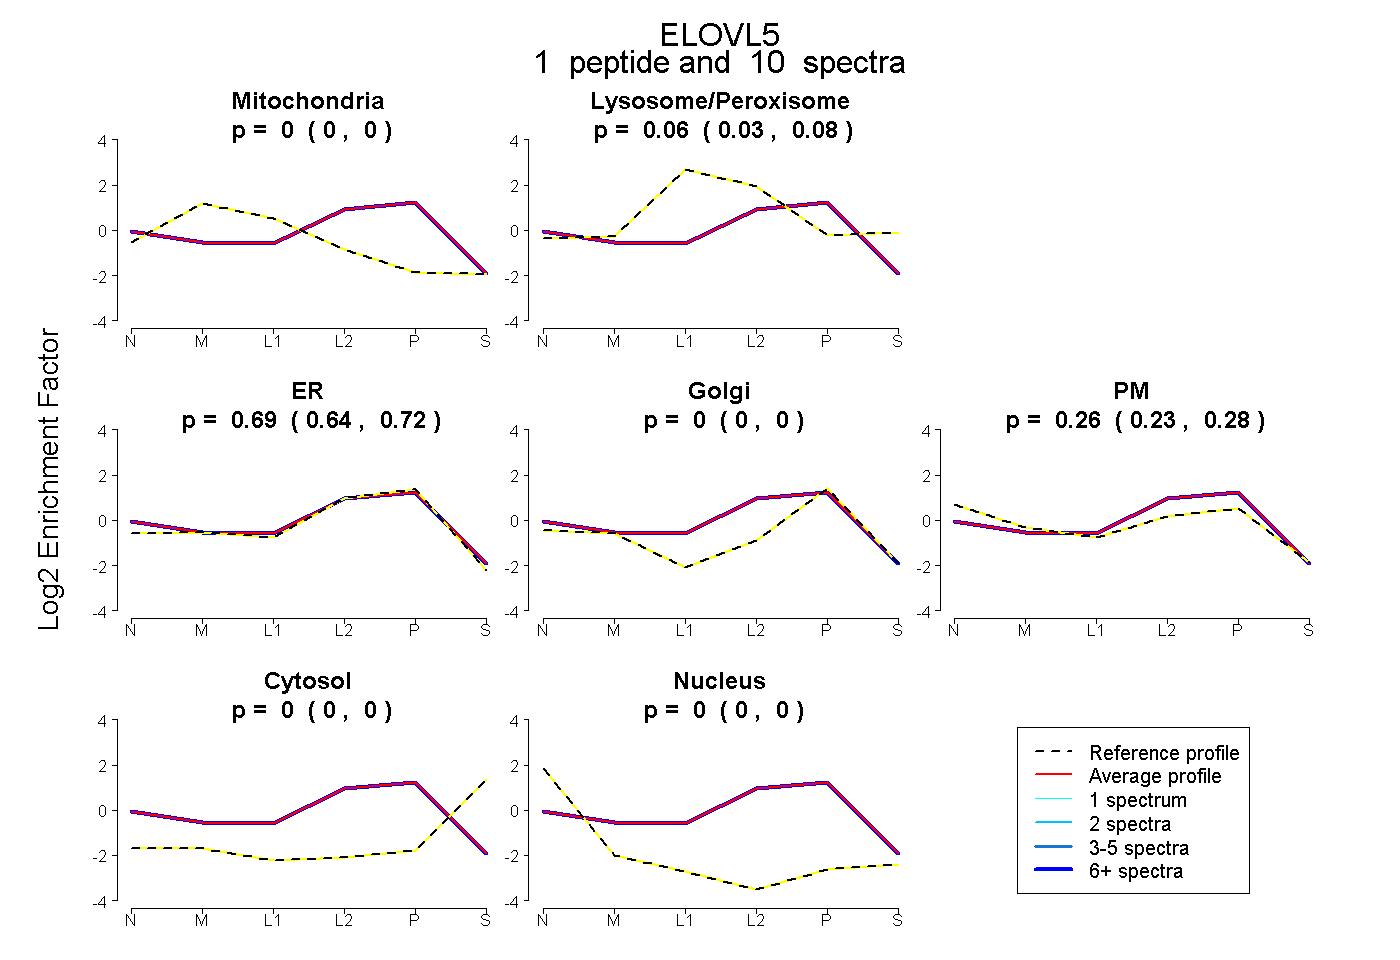 |
0.000
0.000 | 0.000 |
|
0.056
0.030 | 0.077 |
|
0.685
0.640 | 0.717 |
0.000
0.000 | 0.000 |
0.259
0.232 | 0.279 |
0.000
0.000 | 0.000 |
0.000
0.000 | 0.000 |
|
| 10 spectra, ALLGPR |
0.000 |
|
0.056 |
|
0.685 |
0.000 |
0.259 |
0.000 |
0.000 |
|
| | | Plot |
|
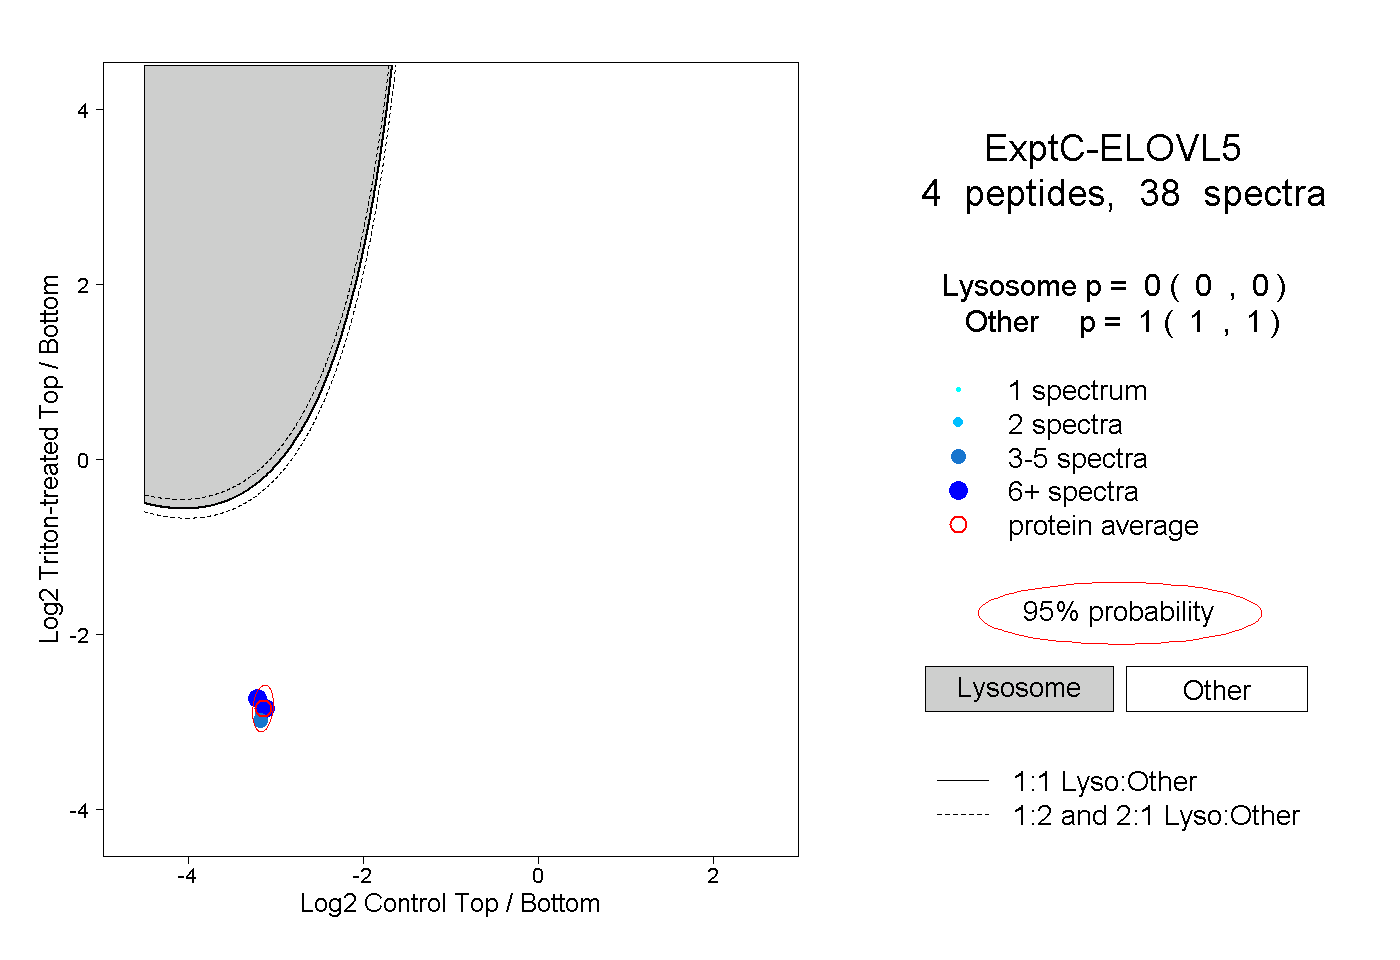
Lyso |
|
|
|
|
|
|
|
Other |
| Expt C |
4
peptides |
38
spectra |
 |
|
0.000
0.000 | 0.000 |
|
|
|
|
|
|
|
1.000
1.000 | 1.000 |
| | | Plot |
|
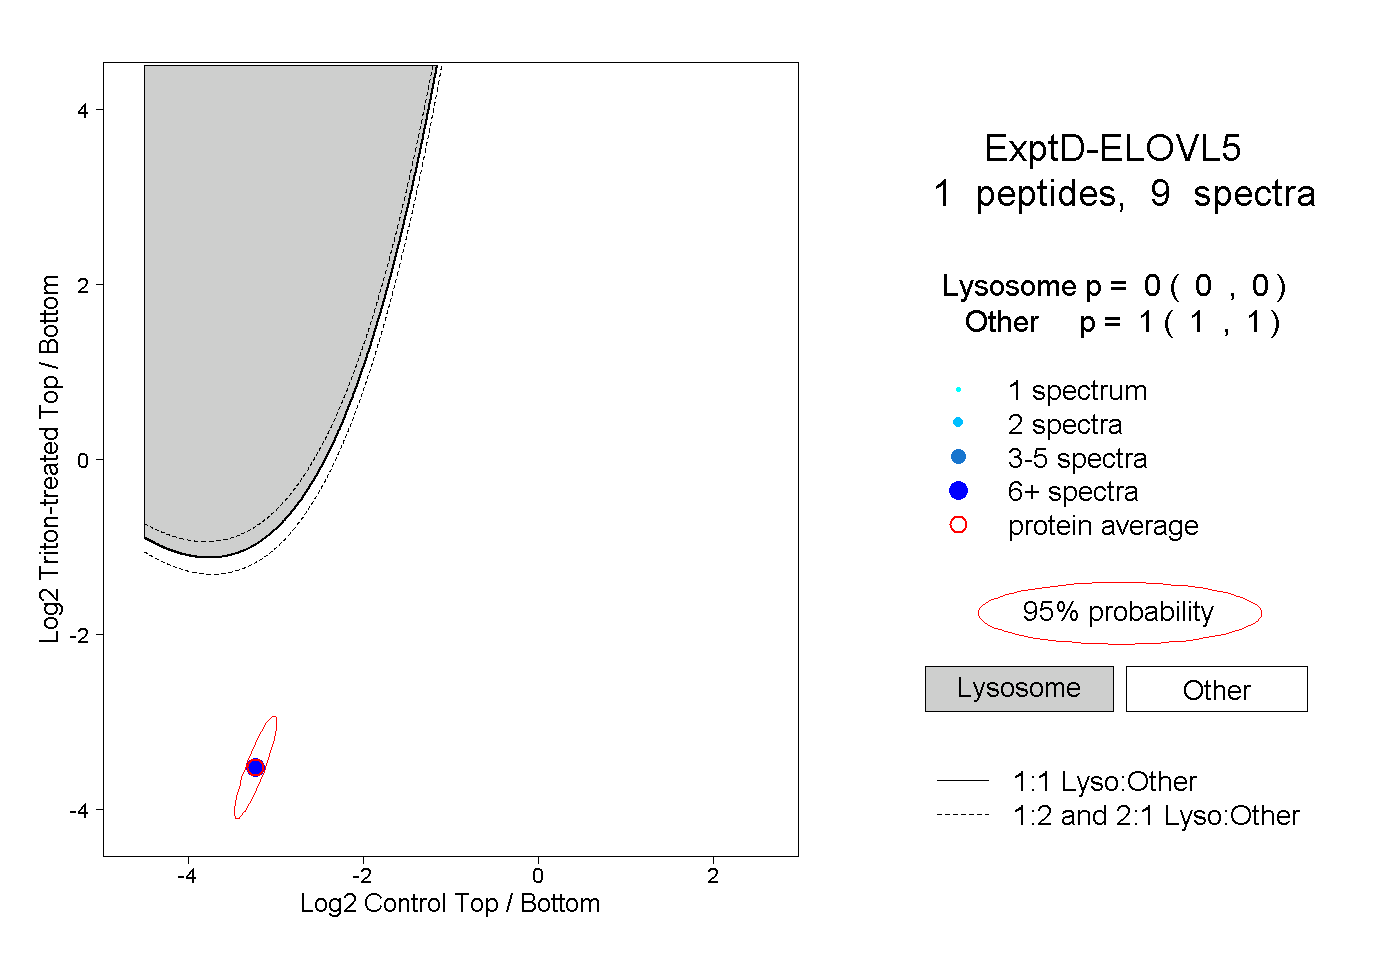
Lyso |
|
|
|
|
|
|
|
Other |
| Expt D |
1
peptide |
9
spectra |
 |
|
0.000
0.000 | 0.000 |
|
|
|
|
|
|
|
1.000
1.000 | 1.000 |